Capacity testing by AWS instance type
Describes recommended testing conditions in Optimizely Configured Commerce.
WebPageTest
Below are our testing conditions, targeted at the conservative end of computers and network conditions, so we get exposure to the whole spectrum of experiences. Bolded metrics are ones that we value the most, with SpeedIndex being the top priority.
Test conditions
- WebPageTest Default Agent Image:
- Windows Server 2008 R2
- Chrome
- Extra Information Gathering:
- Timeline
- Callstack
- Network Profile:
- "Cable" (WebPageTest is a mature tool, part of that is that some of the labels are dated, cable is now much faster, but many people are using mobile networks, so the name is no longer relevant but the profile's settings are)
- Download: 5Mbps
- Upload: 1Mbps
- Last Leg RTT: 28ms
- Test Agent Machine:
- aws m3.medium
- 1 vCPU (core)
- Compute Units: 3 ECU
- Memory: 3.75 GB
Median Baseline Metrics
- RTT between test agent and test server: 81ms
- First Paint: 2245ms (first view) 1820ms (repeat)
- Speed Index: 3210 (first view) 2735 (repeat)
- Time to First Byte TTFB: 868ms (first view) 829ms (repeat)
- Load Time: 4855ms (first view) 4009 (repeat)
- Cpu Busy Time: 3592ms (first view) 3262 (repeat)
Gatling
For our use case we do post-processing of the result data to come up with a metric of "Peak User Sessions Per Hour" that we track. The remaining data we use only for investigating specific cases.
Testing conditions
From Google Analytics of past clients we have created a profile to model what typical traffic is.
Assume 45 seconds per page.
- 63% land on a product page and drop, 1 pages, ~45 second session
- 10% land on the homepage and drop, 1 pages, ~45 second session
- 5% land on a product page and search, repeat 3 more times, 8 pages, ~7 minute session
- 5% land on homepage, search, go to a product, then do search/product cycle 3 more times, 8 pages, ~7 minute session
- 5% land on homepage, go to product category page, go to a product, then do category/product cycle 3 more times, 8 pages, ~7 minute session
- 2% land on homepage, go to product category page, go to a different product category page, view product, add it to cart, 5 page hits, ~4 minute session
We ramp from 0 new user sessions per second, to 150% of our target, over one hour and stop the test when the 99th percentile response time crosses above 10s. While 10s may seem high, there is less than 2% difference in capacity from using cut-off values like 2 or 3 seconds and 10 seconds. However, 10 seconds is much more tolerant of noise, which leads to more consistent results from one run to the next.
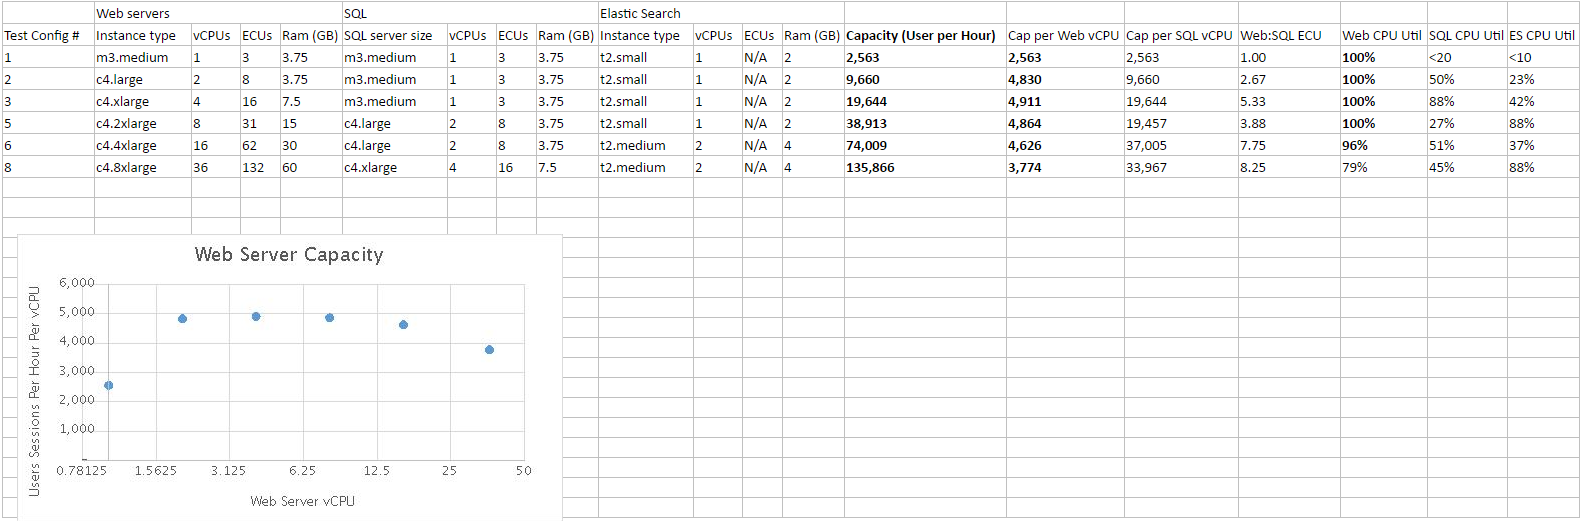
Result Summary: (see below for more info)
| Web Sever Cores | SQL Server Cores | Capacity (User per Hour) |
|---|---|---|
| 1 | 1 | 2,563 |
| 2 | 1 | 9,660 |
| 4 | 1 | 19,644 |
| 8 | 2 | 38,913 |
| 16 | 2 | 74,009 |
| 36 | 4 | 135,866 |
The following test is intended to determine what key infrastructure resources are needed to scale the website and its related services.
Assumptions:
- Most traffic is browsing and adding to cart
- Registration, log-in, and checkout are not a substantial source of load and can be omitted to keep the test as straight forward and repeatable
This test is not intended to:
- Take into account production site requirements, such as high availability, over-provisioning, load-balancing, or monitoring.
- Test integration capacity, including order processing.
Web CPU
The primary resource to plan for is Web Server CPU. The results show that from 2 to 16 cores the application scales linearly, with a stable 4,600-5,000 user sessions per hour per core. The test with a single core shows a efficiency of about 1/2 of dual-core. This is logical as the application code is forced to share a single resource with OS and IO activities. At 36 cores the application becomes unpredictable, from one test to the next there is a large amount of variability in the results. Result of up to 3,800 user sessions per hour per core, a scaling efficiency of 75%, which is expected as hardware inefficiencies arise from multi-socket machines with NUMA. However, I could not get this result again, I got results as low as 970 user sessions per hour per core, for a total of 35,000 user sessions per hour capacity, which is less than the 8 core test.
Dependencies
The testing shows that scaling the services that Configured Commerce depends on closely follows the scaling of the Web tier. SQL has an ideal ratio of 10:1 of the web tier. And again, single-core SQL is derated by 50% because of forced sharing a single resource with OS and IO activities. So a single core SQL server could support a 5 core web server, and a dual core SQL server could support a 20 core web server. Similarly Elasticsearch, has an ideal ratio of 1:20, with a derating of 50% for single core. So a single-core Elasticsearch instance can support a 10 core webserver, and a dual-core can support a 40-core webserver. While scaling SQL and Elasticsearch, you must allow head room for periodic background cleanup tasks. For SQL the sustained CPU should not go above 90% for single-core machines or 80% for multi core machines. For Elasticsearch sustained CPU should no go above 70%.
RAM
Ram capacity was not significant in testing. Web server and SQL server ram usage remained around 2GB, which even on the smallest instances left plenty of room for filesystem cache. Elasticsearch used 1gb, which again left room for filesystem cache. For comparison the SQL database is 5.1GB, The elasticsearch index is 1.3GB, and the UserFiles are 60 MB. I expect that the largest driver of RAM usage is the size of the hot and warm datasets, but further testing would need to be done to validate.
Disk access
As the site is warmed, there is moderate disk access, but then it drops very low. Throughout testing, I never saw more than 2% disk utilization for 2 consecutive data points. Along with RAM I expect hot and warm data set sizes are the largest drivers of this, but further testing would need to be done to validate.
Failure mode
While web CPU is limiting, the application latency climbs until errors occur as timeouts are hit. While this is happen the service remains stable, error rate climbs, but the server successfully responds to as many requests as possible, and the service remains up, but degraded. In contrast when SQL or Elasticsearch is limiting, the failure mode is catastrophic. Resource utilization never quite reaches 100% on SQL or elasticsearch, but queued work climbs, and request latency climbs, until a livelock situation occurs and all work comes to a halt. For SQL it was pagelocking, for Elasticsearch it was garbage collection. In either case, Web CPU climbs sharply, so be aware that it may be SQL or Elasticsearch causing high web CPU. that is100% Web CPU and 80% SQL might be SQL failing, not Web.
Conclusions / guidance
-
1 resource is Web CPU
- All CPU capacity should derate single-core to 1/2 core of capacity
- Web CPU should be planned for 5,000 user sessions per hour per core, with appropriate over provisioning
- SQL CPU should be planned for 1/10th the capacity of Web
- Elasticsearch should be planned for 1/20th the capacity of Web
- Ram and Disk were not important in this test, but expect demand to increase with larger or more complex data sets
- Web gracefully degrades when it reaches its capacity
- When Elasticsearch or SQL reaches capacity the system fails, and requires manual intervention.
- Over-provisioning SQL and Elasticsearch with respect to Web, produces a favorable failure scenario
- After warm-up, response time is flat until capacity is reached.
Test results
Updated 14 days ago