GEO Analytics for CMS (PaaS)
The GEO Analytics dashboard in Optimizely Reporting helps you understand and optimize your site's performance for AI platforms by tracking AI traffic trends, identifying frequent AI agents, and discovering popular webpages among AI platforms.
ImportantThe GEO Analytics dashboard is a legacy feature and is available only for customers who received access before May 31, 2026. Switch to the Agent Visibility dashboard in Optimizely Analytics, which provides additional request intent and enriched Optimizely Opal facets data for more robust and action-oriented analysis.
Use the Generative Engine Optimization (GEO) Analytics dashboard in Optimizely Reporting to view AI platform traffic and optimize your site performance.
GEO Analytics helps you track AI traffic trends, identify frequent AI agents, and discover popular webpages among AI platforms. Use this data to refine content for AI optimization and use high-performing pages to improve overall engagement.
Prerequisites
To use the GEO Analytics dashboard, you need the following:
- An Opti ID account.
- Access to a CMS 13 instance.
- If headless, a front end hosted with Optimizely.
Site navigation
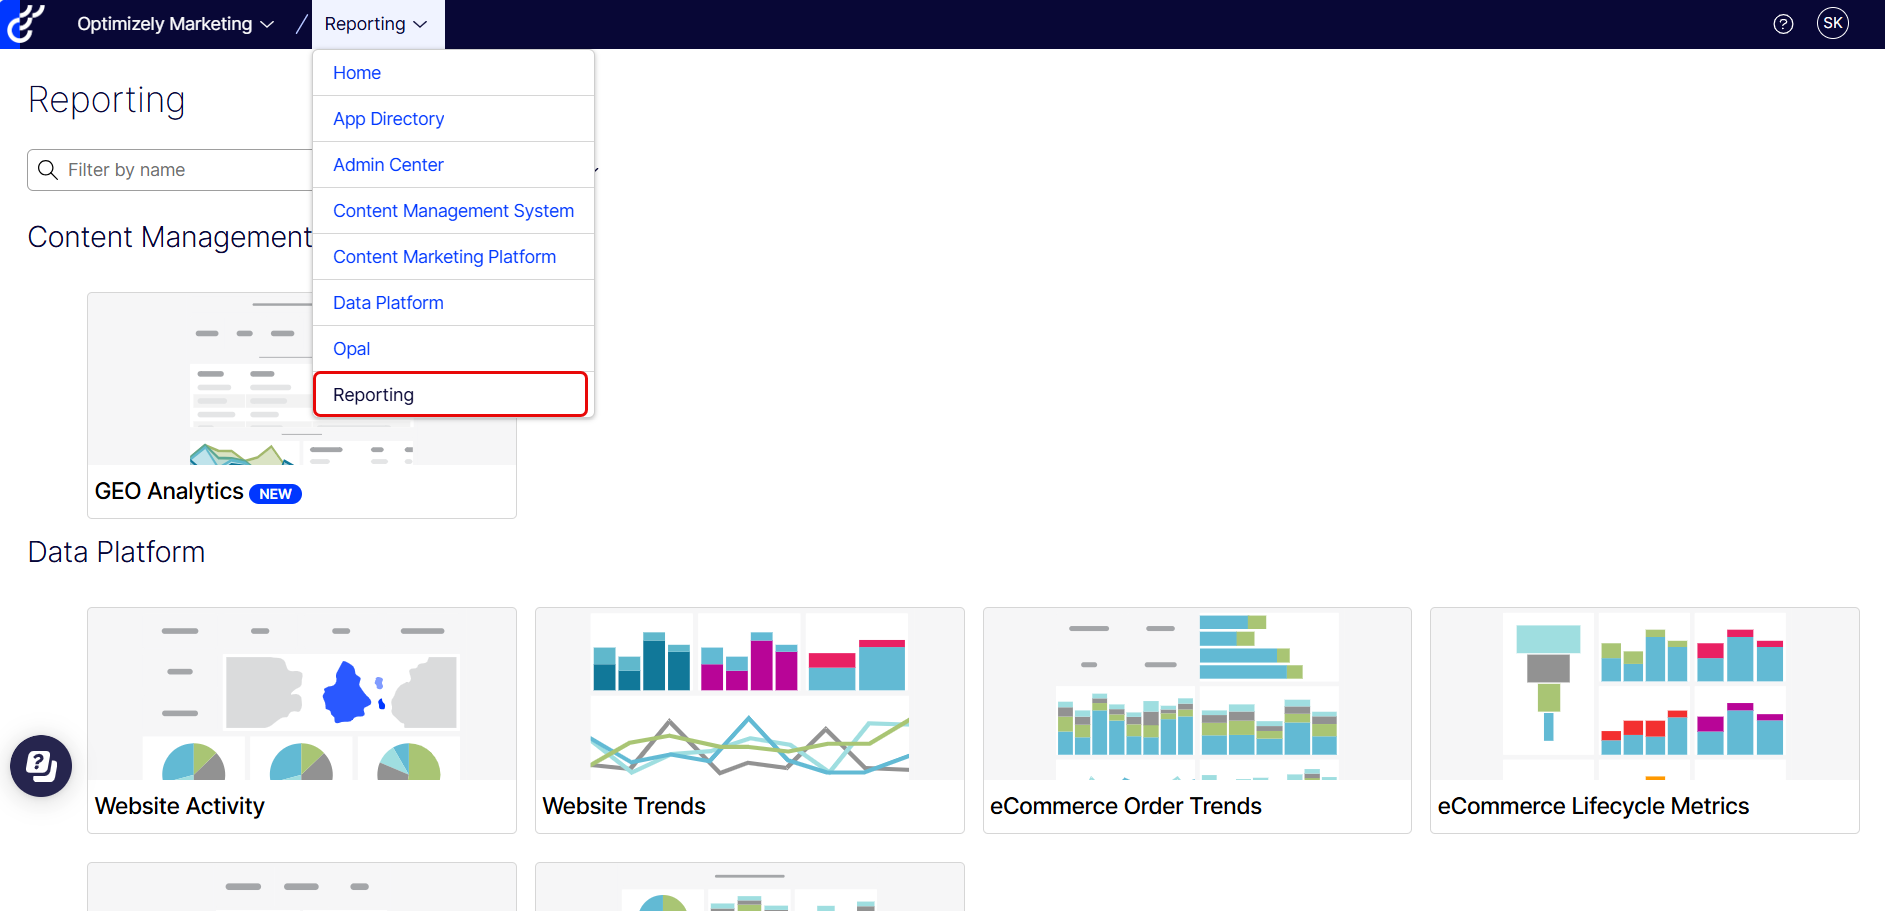
Access the GEO Analytics dashboard from Optimizely Reporting.
-
Log in to your CMS instance.
-
Select Optimizely Reporting or use the product switcher in the global navigation bar.
-
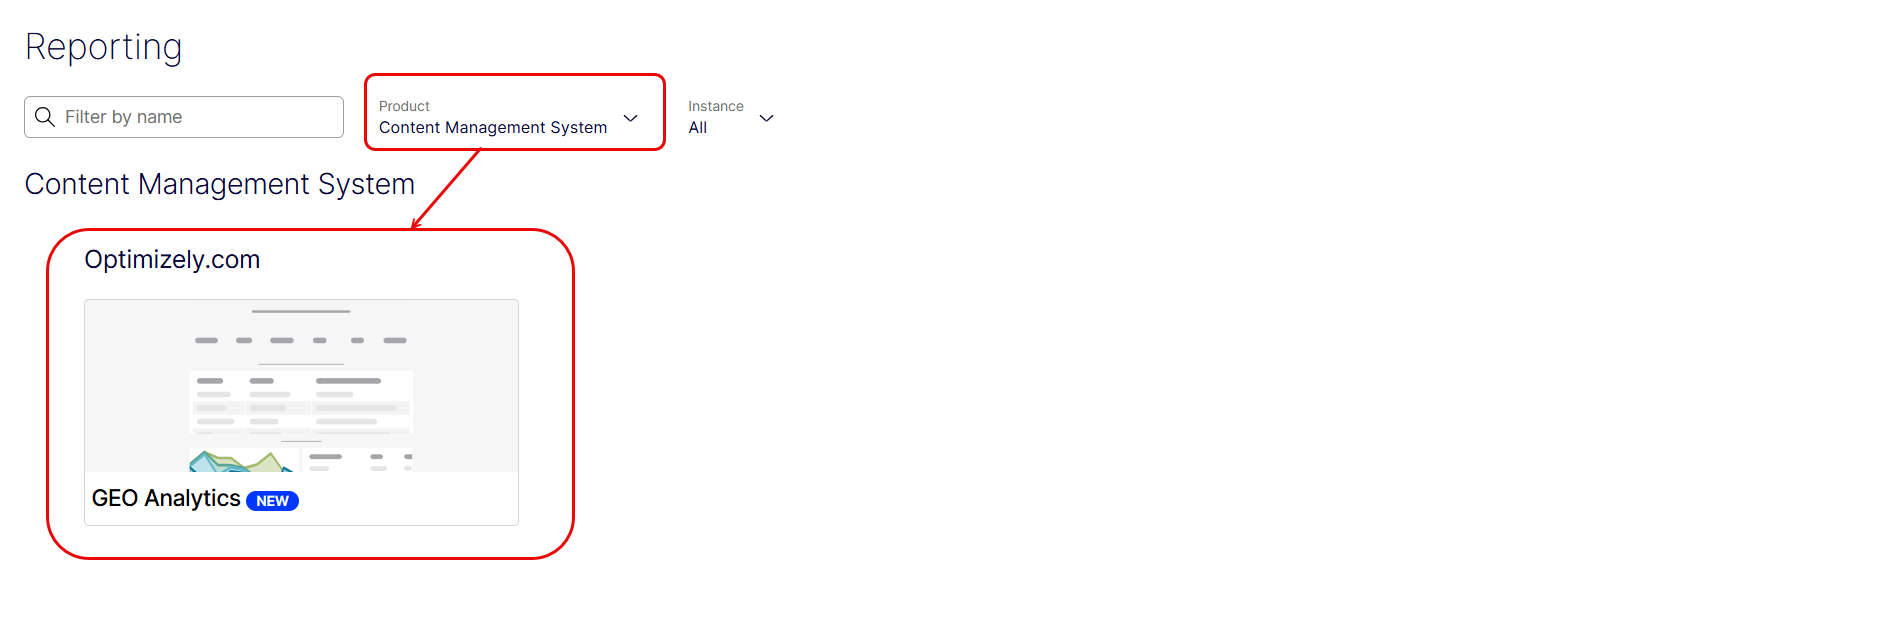
After you log in, scroll down and click the GEO Analytics dashboard, or select Content Management System from the Product drop-down list.
View GEO analytics
Review AI crawler activity and page performance data to understand how AI platforms interact with your site.
View data
The GEO Analytics dashboard displays the following four data tables:
-
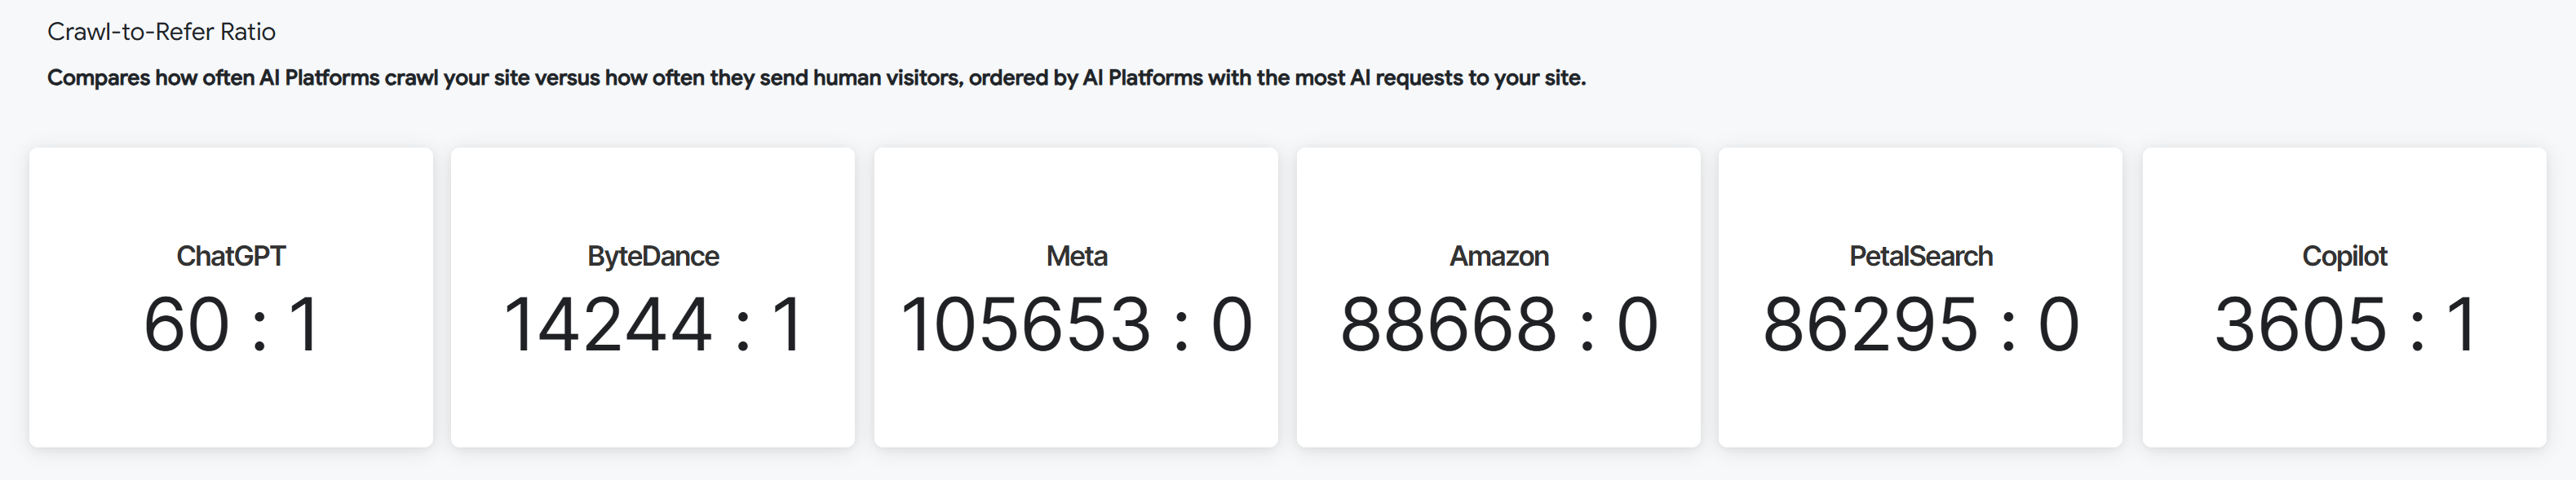
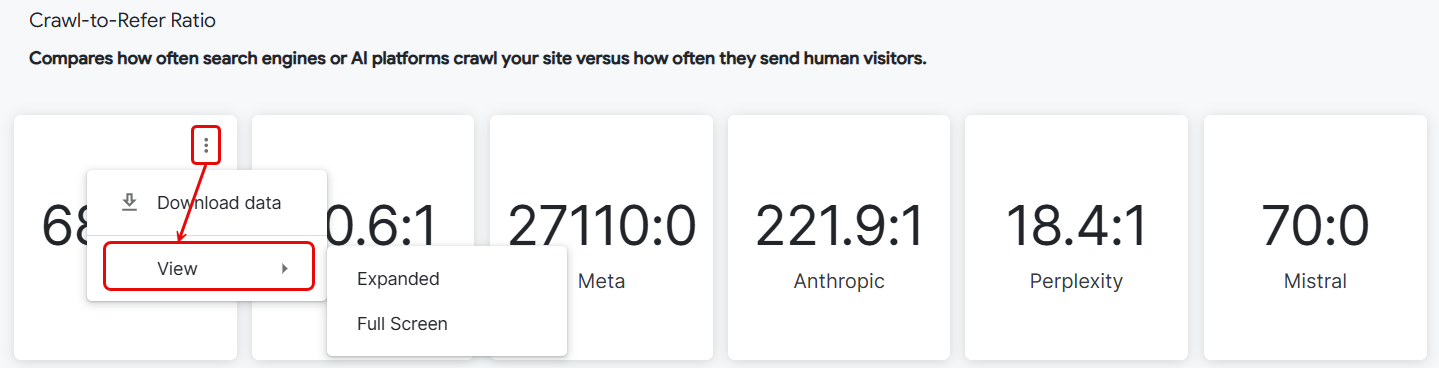
Crawl-to-Refer Ratio – Displays the crawl-to-refer ratio for the top six AI crawlers, ordered by request volume. The ratio compares how often AI crawlers visit your site to how often those visits lead to referrals. A high ratio means crawlers visit frequently but do not use your content extensively. A low ratio indicates that your pages are referenced in proportion to visits. Keep the ratio as low as possible.
-
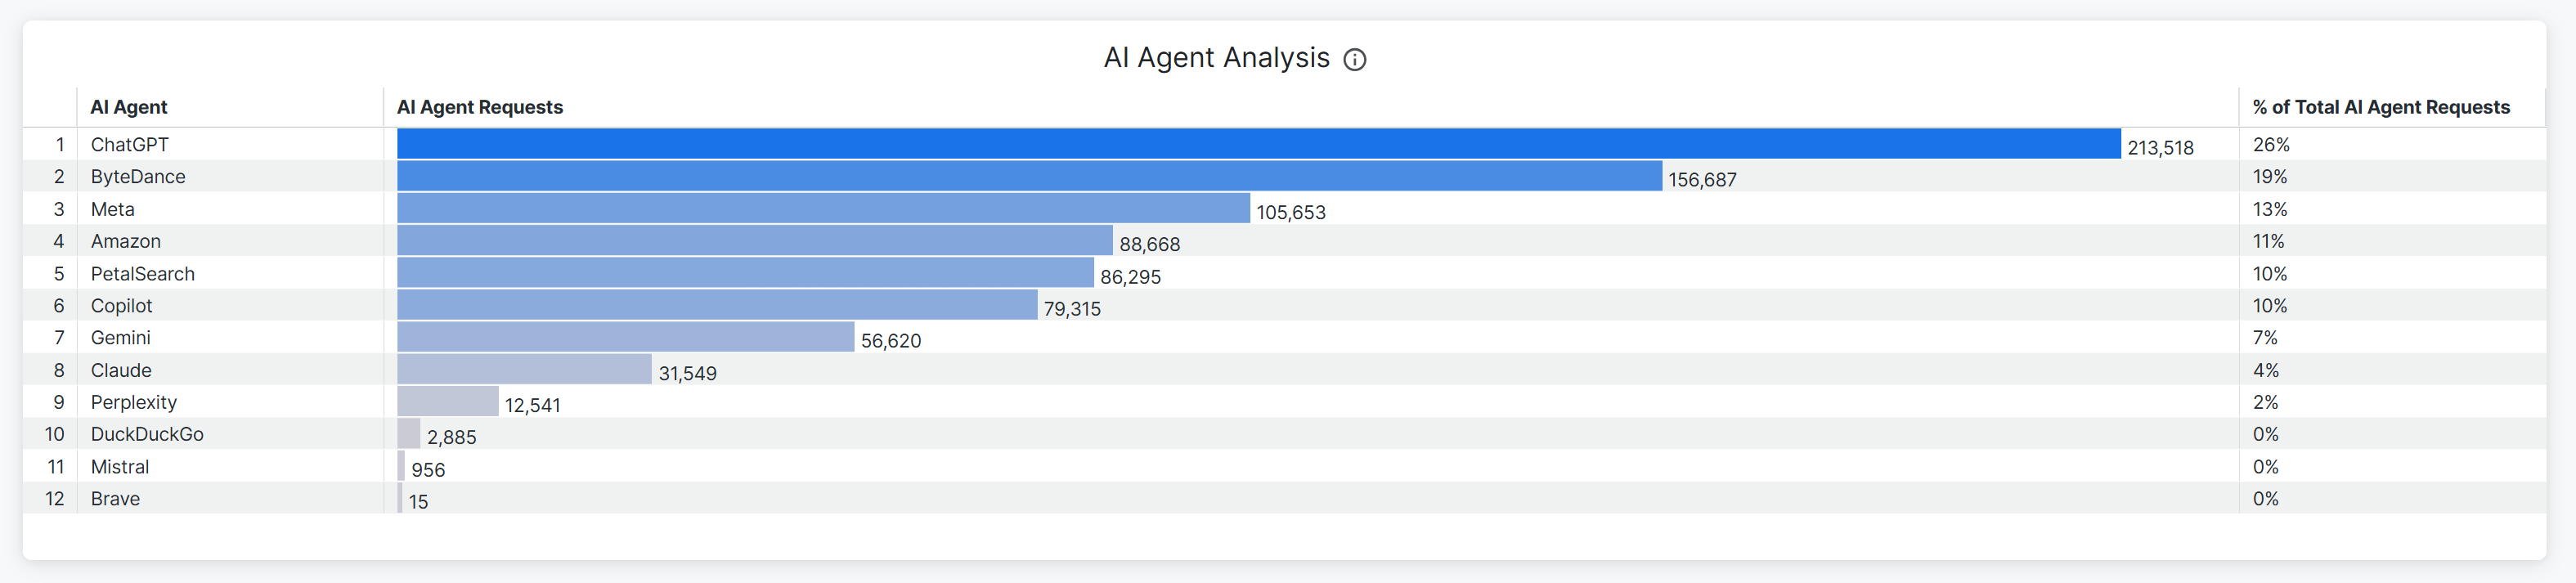
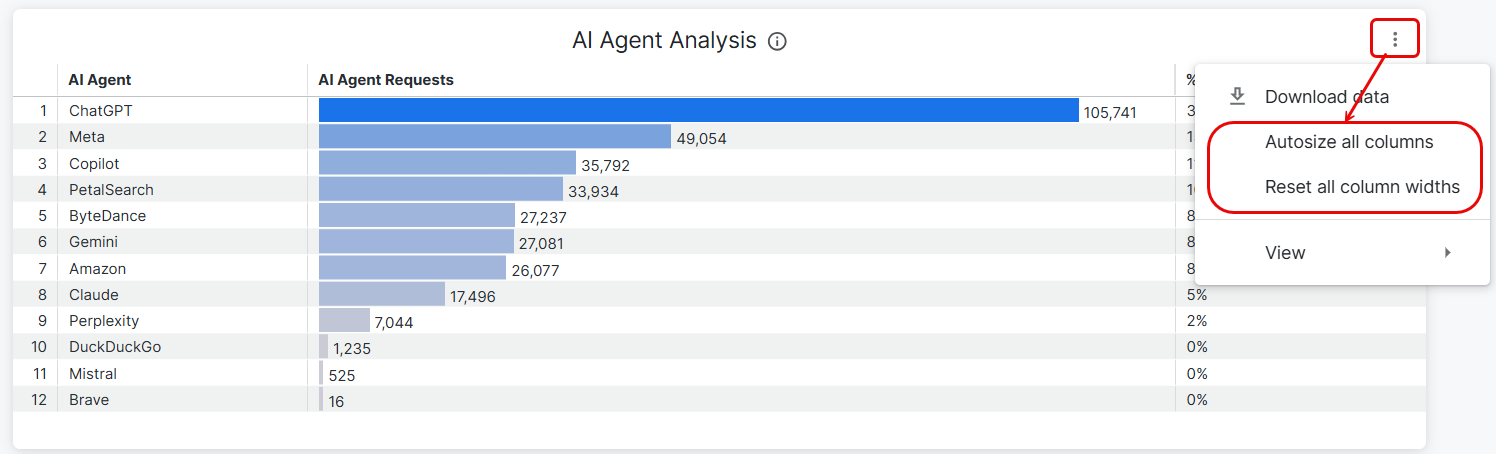
AI-Agent Analysis – Displays the summary of AI agent activity, categorized by request volume. The data table displays the top 12 AI agents that are static (including the top six displayed in the Crawl-to-Refer Ratio section), their corresponding request counts, and their percentage of total AI agent requests.
-
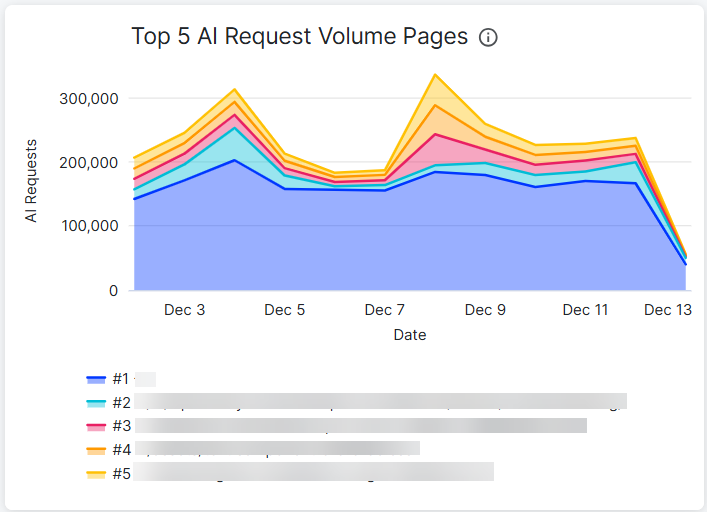
Top 5 AI Request Volume Pages – Displays HTTP request trends for the top five pages, highlighting which pages are most frequently accessed by specific AI bots and crawlers within your selected time period.
-
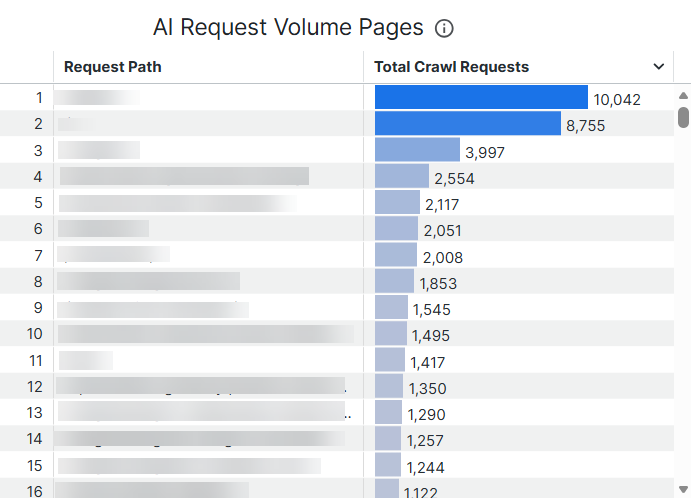
AI Request Volume Pages – Displays the number of total AI crawler requests for each page within your selected time period.
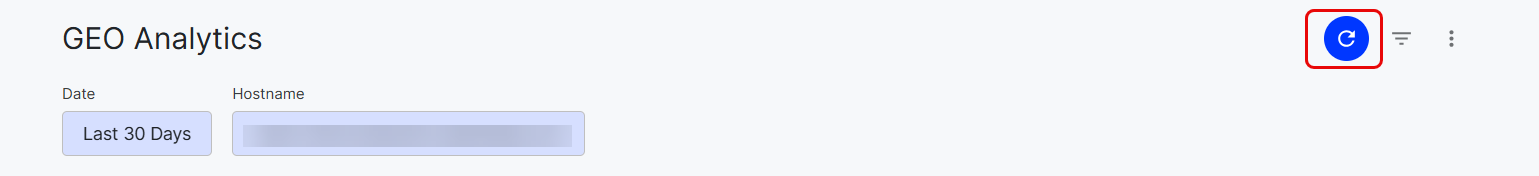
Filter data
Filter the dashboard by date range and hostname to narrow the data.
-
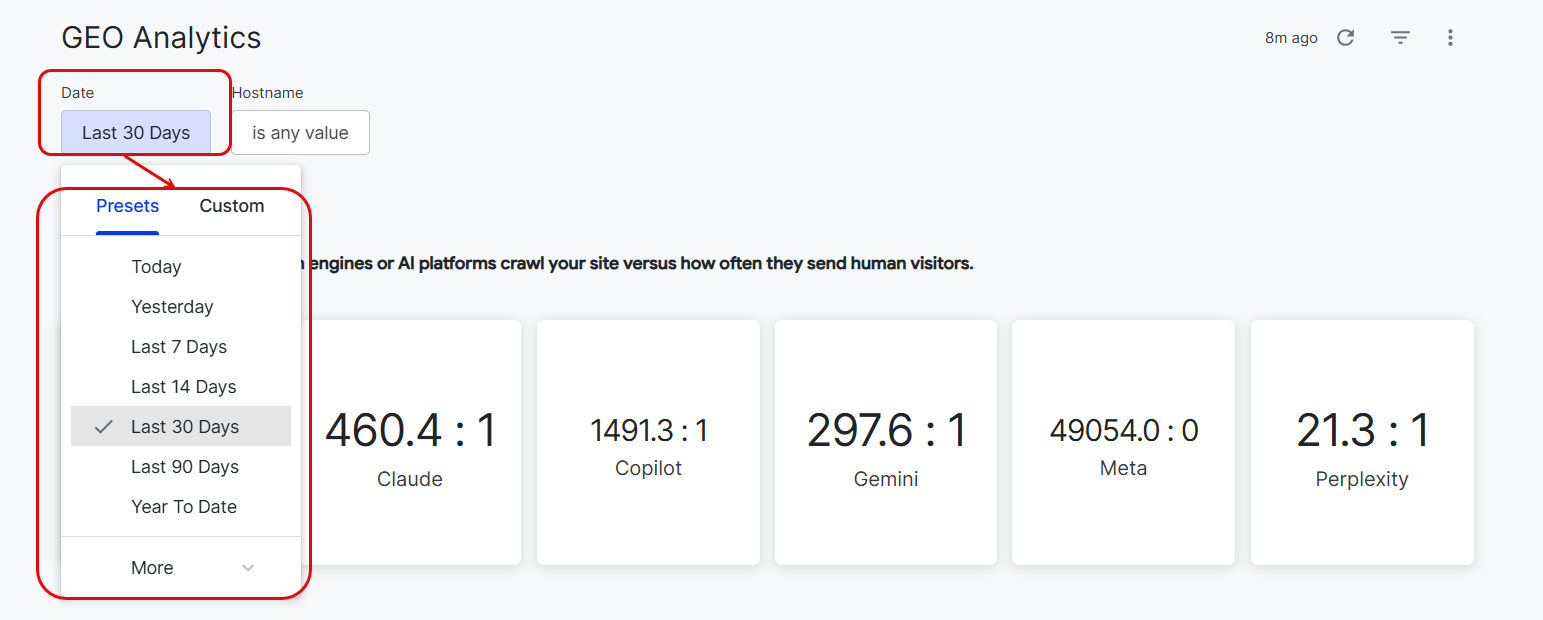
Click Date > Last 30 Days and choose a preset time period or click Custom to define your own.
NoteData is available from November 28, 2025, onwards.
-
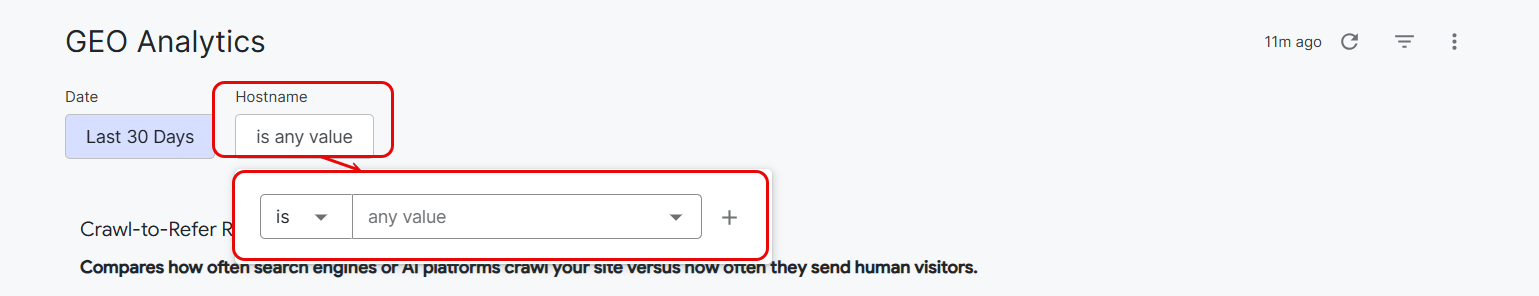
Click Hostname > is any value and an operator from the drop-down list, then select one or more websites from the any value drop-down list. Click Add to add additional hostnames.
-
Click Update. When you adjust the filters, you must click Update again to apply your new settings.
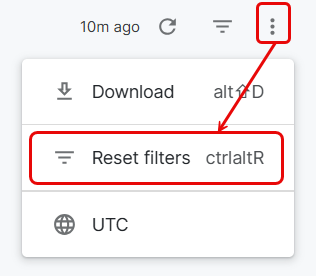
Reset dashboard filters
Click Dashboard actions > Reset filters to clear the filter settings and return to the defaults. The dashboard reloads automatically.
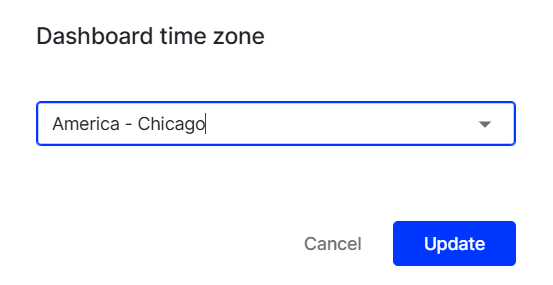
Update the time zone
Click Dashboard actions > UTC to change the time zone. Select your desired time zone from the drop-down list, then click Update.
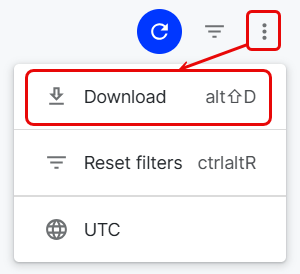
Download the dashboard
Export the dashboard as a PDF or CSV file.
-
Click Dashboard actions > Download.
-
Complete the following fields:
- Format– Select PDF or CSV.
- PDF– Generates one file for the dashboard.
- CSV – Generates a file for each row in the dashboard.
- Paper Size – Select Fit Page To Dashboard, Letter, Legal, Tabloid, A0, A1, A2, A3, A4, or A5. For information on A paper sizes, see papersizes.org. An additional Orientation option (Portrait or Landscape) displays for Letter, Legal, and Tabloid.
- Expand tables to show all rows – Select this checkbox to display all rows in each table.
- Arrange dashboard tiles in a single column – Select this checkbox to display dashboard tiles in a single column.
- Format– Select PDF or CSV.
-
(Optional) Click Open in Browser to view the results in a browser tab. This option is available only for PDF format.
-
Click Download.
Download data, sort, freeze, copy values, and resize columns
Use these features to customize how data displays in the AI Agent Analysis, Top 5 Request Volume Pages, AI Request Volume Pages, and Crawl-to-Refer Ratio tables.
Download data
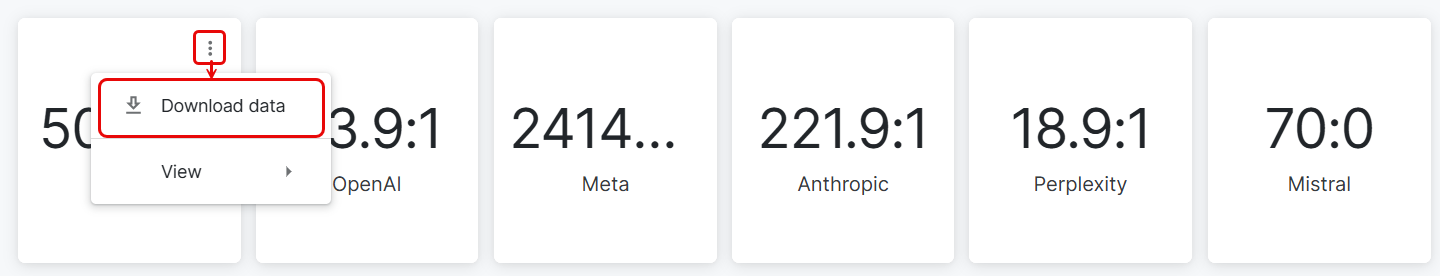
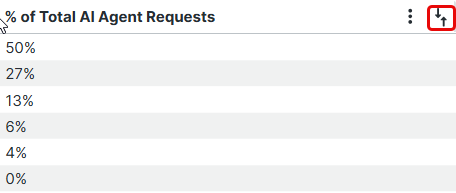
To download data from an individual table or card:
-
Point to the card (for Crawl-to-Refer Ratio) or table title row (for the other tables) and click Tile actions > Download data.
-
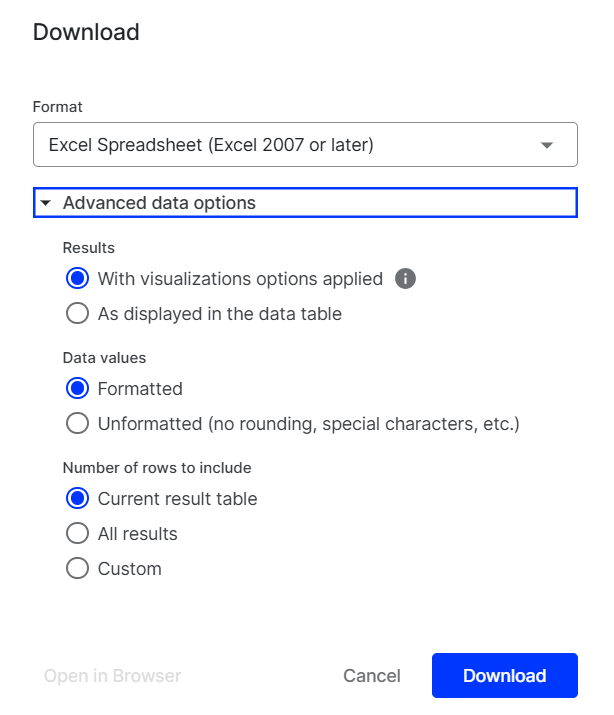
Select your desired Format.
-
(Optional) Expand the Advanced data options section and adjust formatting for the download.
-
(Optional) Click Open in Browser to view the results in a browser tab. This option is not available for the Excel spreadsheet format.
-
Click Download.
Sort columns
Sort the AI Agent Analysis and AI Request Volume Pages data tables:
-
Point to the table title row.
-
Click the sort icon to sort in ascending or descending order.
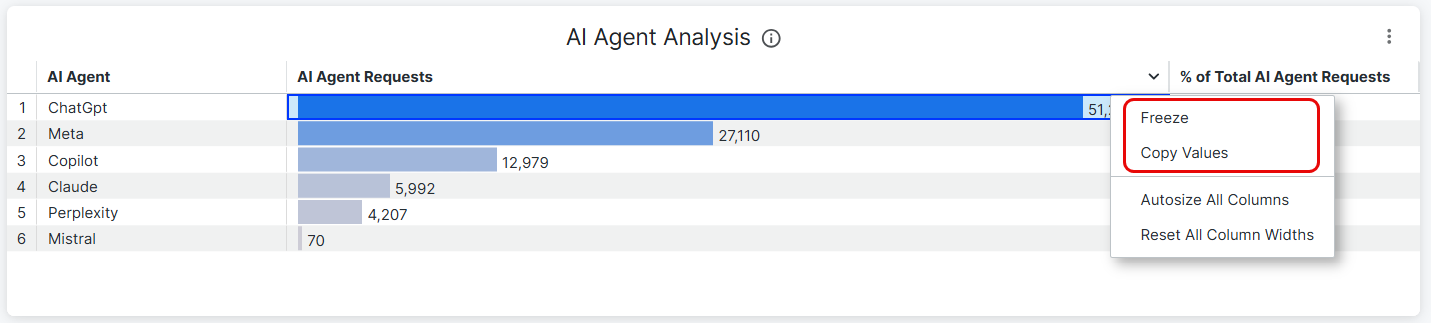
Freeze data and copy values
Freeze rows or copy data in the AI Agent Analysis and AI Request Volume Pages tables:
-
Point to the header row for either column.
-
Click Column Options to access the following actions:
- Freeze – Select your desired rows from the column, then click Freeze to keep them visible when you scroll through the table.
- Copy values – Click to copy values for the entire table.
Resize columns
Adjust column widths in the AI Agent Analysis and AI Request Volume Pages data tables using two methods:
-
Point to the table title row and click Tile actions.
-
Point to the header row of any column and select Autosize All Columns.
-
Click Reset All Column Widths to restore columns to their original size.
Change view
Switch to a different layout for any data table:
Updated 12 days ago