Dashboard overview
View and configure sales metrics and charts on the Commerce Connect dashboard.
Optimizely Commerce Connect provides a dashboard that displays metrics when you log in.
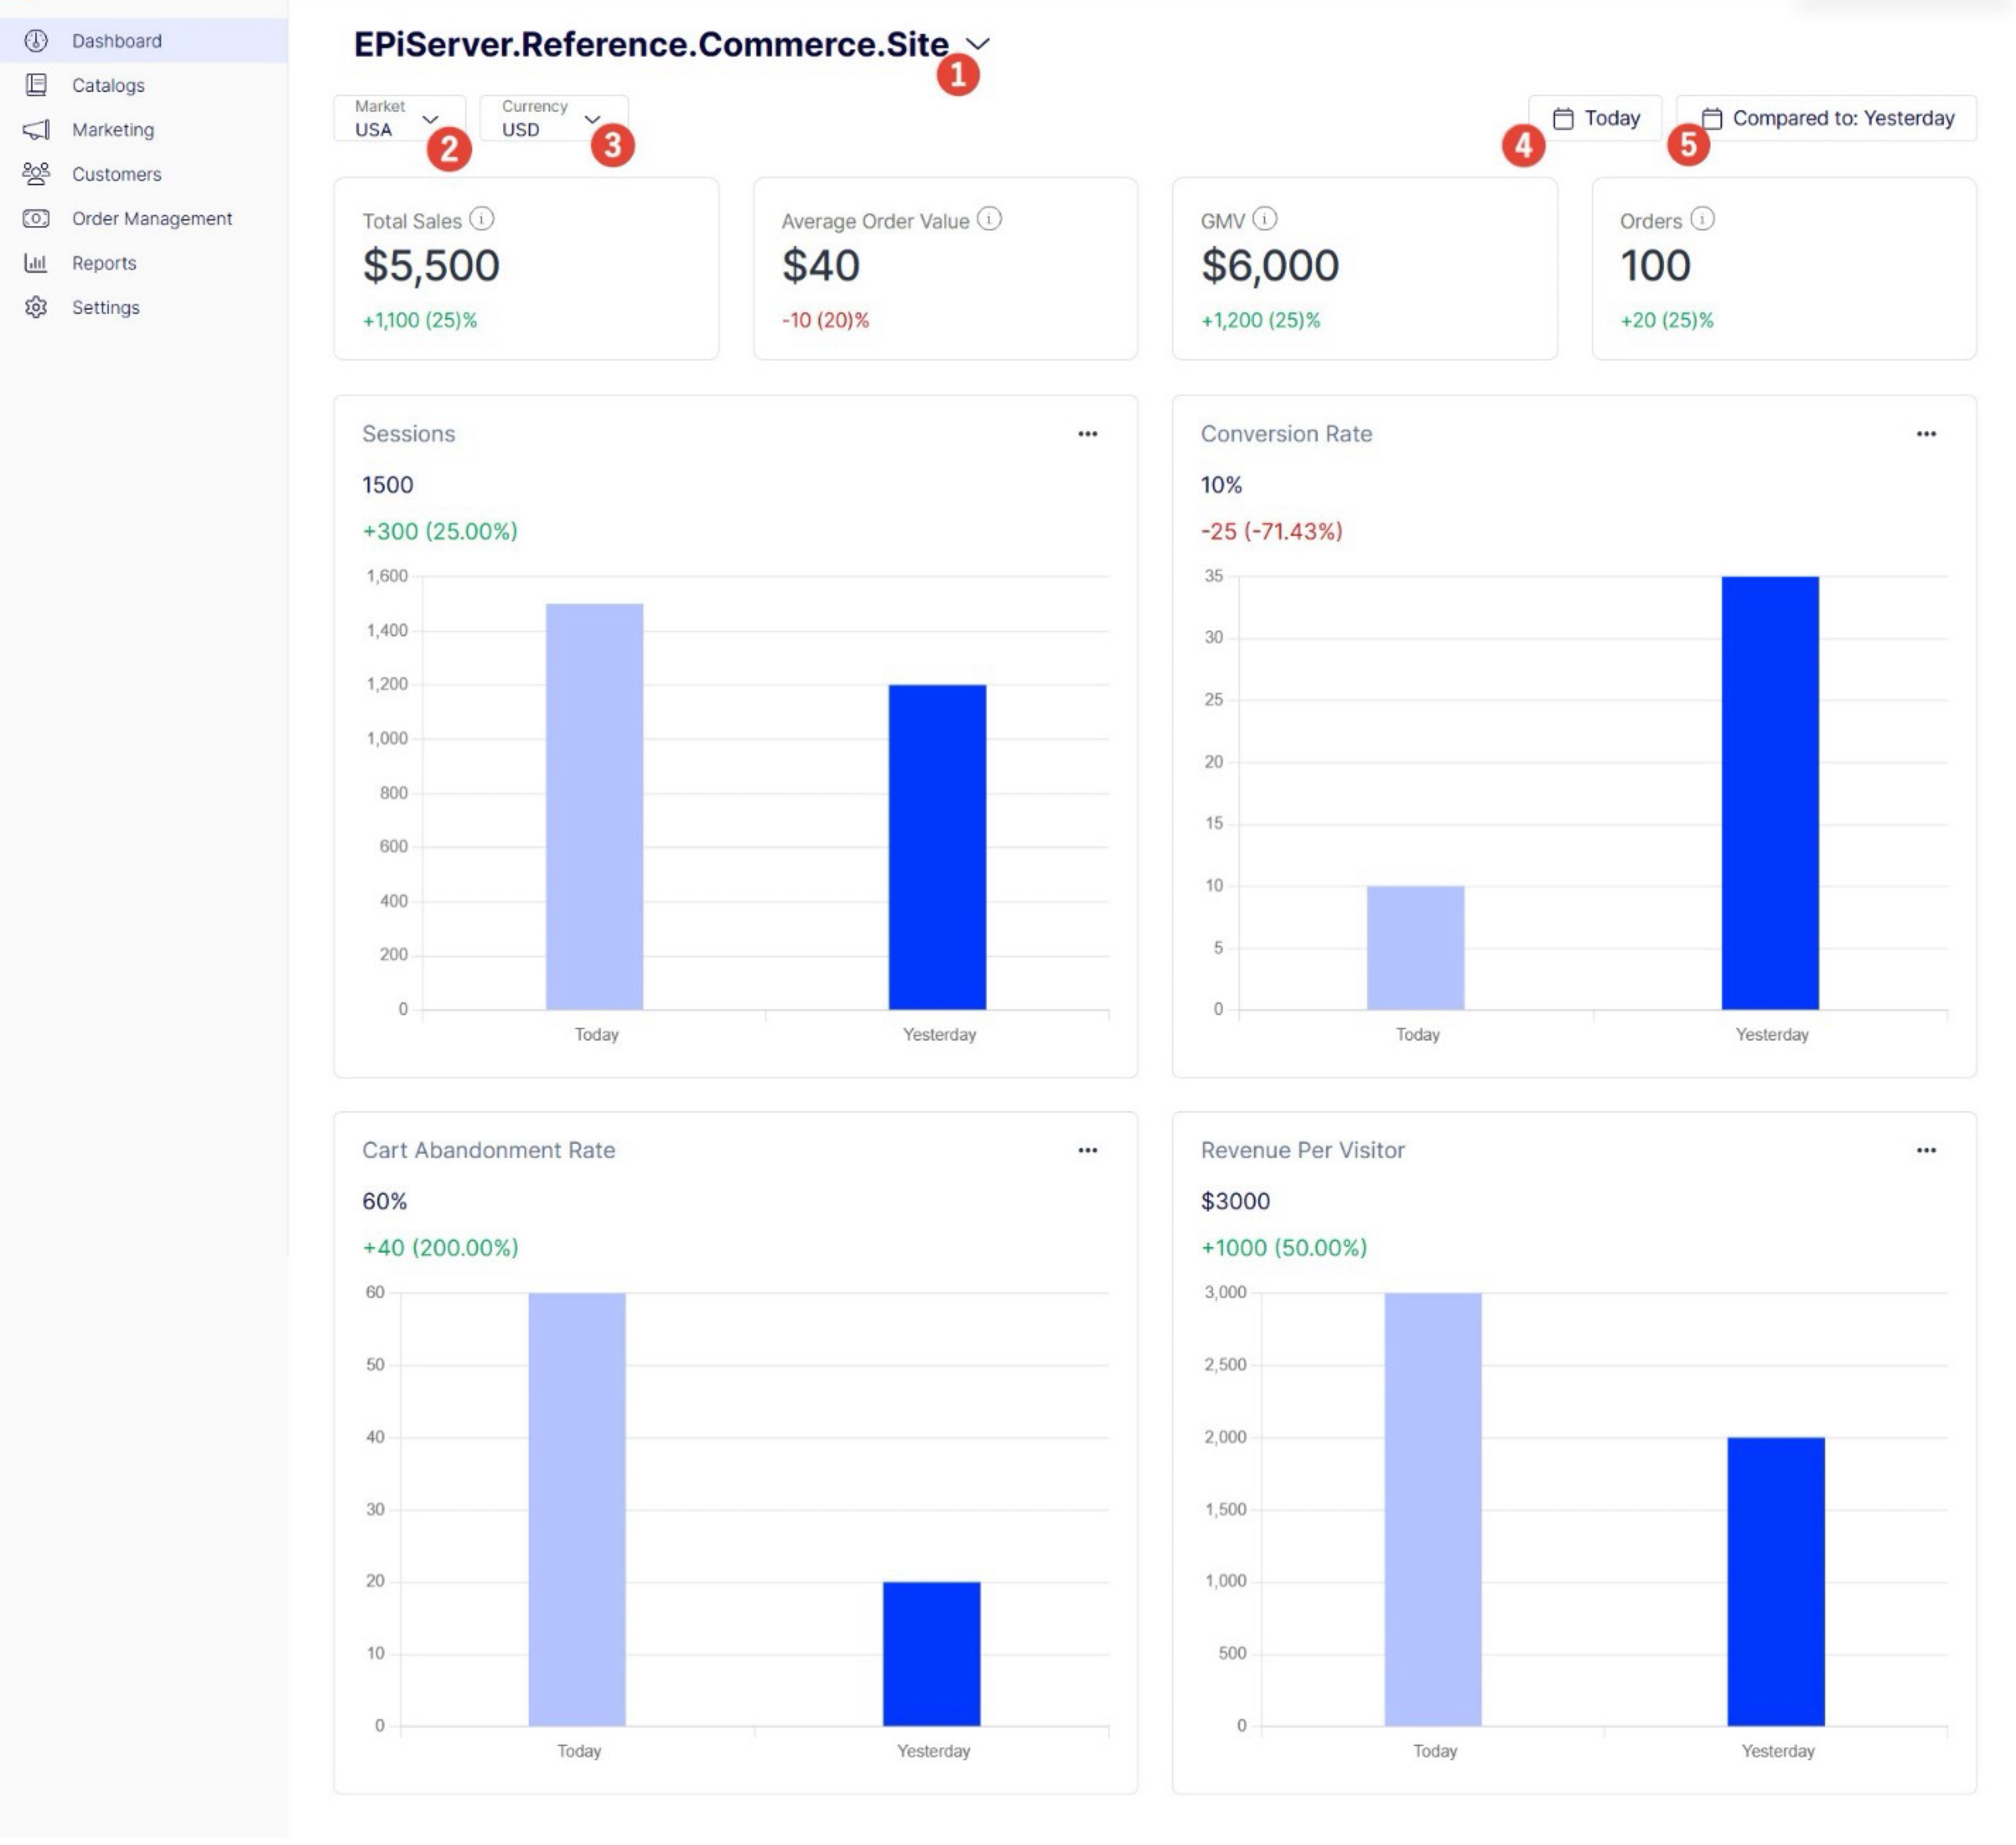
The page contains options to edit what data displays for each metric and chart.
-
Change Website – Click the dashboard's title to select a different website.
-
Market – Choose a market, such as USA.
-
Currency – Choose what currency to use, such as USD.
-
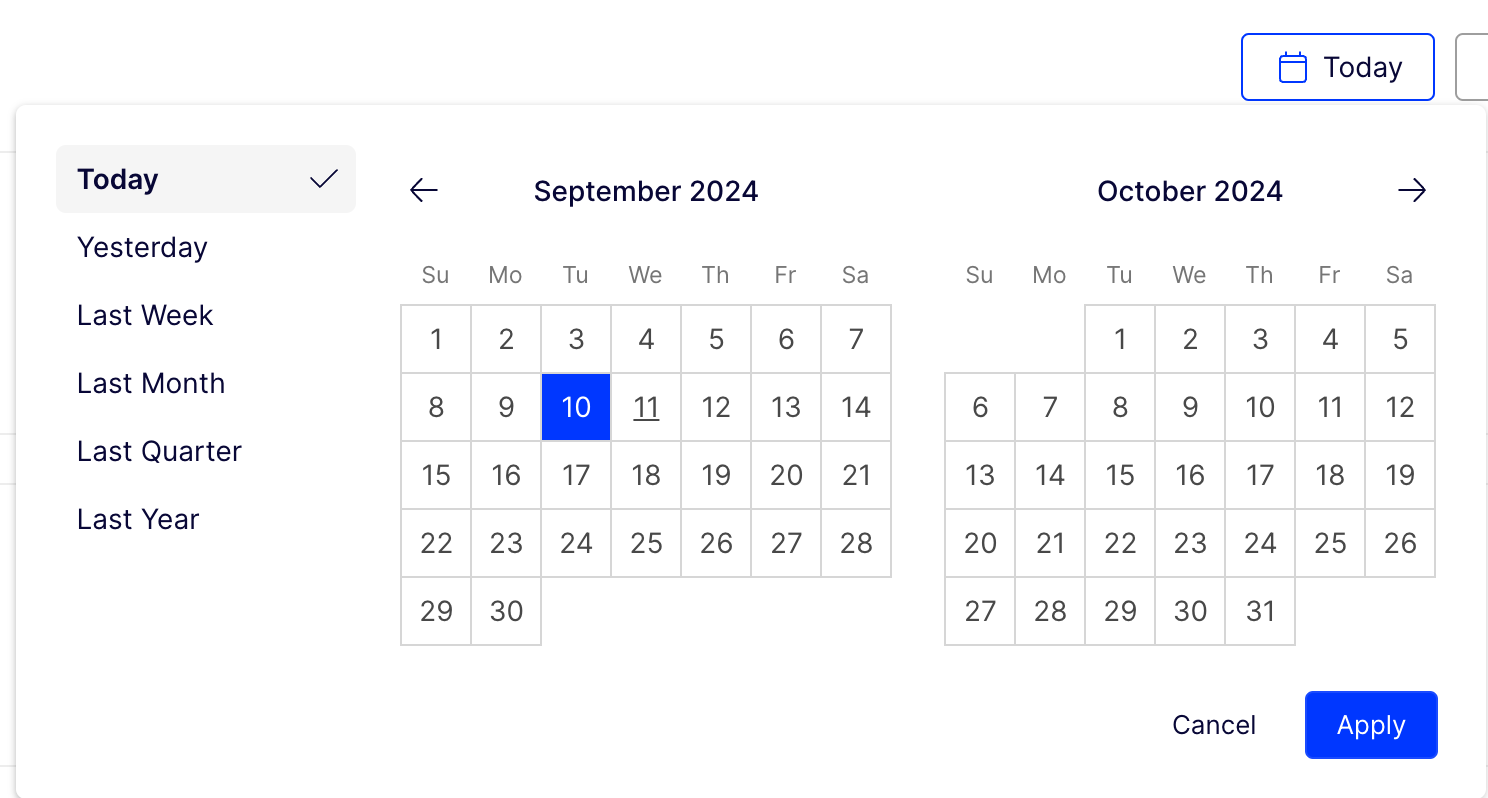
Date Picker – Select the time period for the data. Premade options include Today, Yesterday, Last week, Last month, Last quarter, and Last year. Click Apply.
-
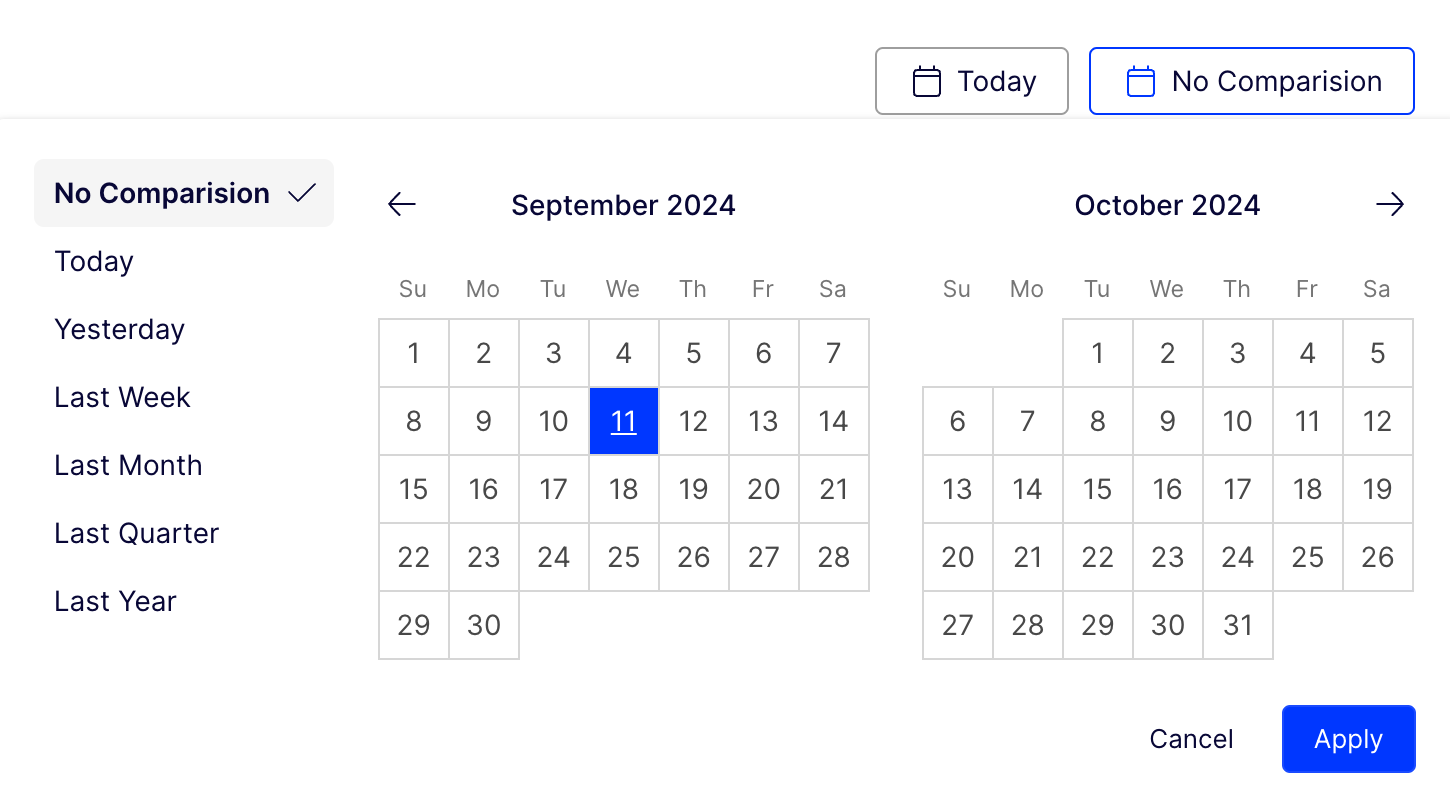
Compare to – Select a time period for comparing the data. Premade options include Today, Yesterday, Last week, Last month, Last quarter, and Last year. Click Apply.
The dashboard tracks the following metrics:
-
Total Sales – Gross sales including shipping, taxes, duties, and fees, minus any discounts and returns. This includes all sales channels.
-
Average Order Value – Gross sales (minus discounts) divided by the total number of orders. This excludes edits, exchanges, or returns made to an order after initial placement.
-
GMV – Sales price of products multiplied by the number of products sold.
-
Orders – Total number of orders made across all sales channels.
-
Sessions chart – Number of user sessions over time. A session represents a period of user activity on your site. This chart helps monitor overall site traffic trends or identify peak activity periods.
To enable tracking the session, a developer must add the following configuration in
appsettings.json:{ "Commerce": { "DashboardOptions": { "EnableTrackingSession": true } } }If you do not have this setting, the default value of
EnableTrackingSessionisfalse, and the chart is blank. -
Conversion Rate – Percentage of the number of conversions (customers who already purchased) for total number of visitors (unique website visitors) in a period.

-
Cart Abandonment Rate – Percentage of shopping carts that were abandoned. This chart compares abandonment rates over time and helps monitor the effectiveness of cart recovery strategies.

-
Revenue Per Visitor – The average revenue generated from each site visitor. This chart measures the value each visitor brings to your business and tracks changes in visitor quality or spending habits.

NoteUse the Order per hour schedule job to collect and save order data by hour. See Scheduled jobs for information.
Updated 12 days ago