
Monitor and improve website performance
Suggestions for correcting common issues that impact the speed or responsiveness of websites and how to monitor and debug using Google Chrome or other tools.
With Optimizely Configured Commerce, you can be more proactive with website performance issues. These are some suggestions; you could also use other solutions to resolve issues.
Common server-side issues
The most common server-side issues are database bottlenecks. Customizations that load a large amount of table data can significantly slow performance.
A typical database mistake is to obtain a repository .GetTable() queriable and then chain .ToList() before filtering the results with .Where. This causes the table to be read into memory instead.
When there are performance problems, you should review the custom database access code and look for queries that might be loading too much data or doing so frequently.
- SQL Profiler – If you cannot locate a database problem, run SQL Profiler on the database to examine the activity for large queries.
- CPU Profiler – A CPU profiler can help find SQL slowness or other performance hotspots. In this case, you must run the site locally and load a page (or REST API call) while tracing with the profiler and examining where most of the time is spent executing code. Visual Studio includes a profiler, but you should use Ants Performance Profiler or JetBrains DotTrace.
Configured Commerce has several layers of caching that you should utilize. You can use the following settings to manage caching:
- Cache CMS Content – Set to YES on production sites.
- Cache Etags – Set to YES. This caches REST API results and other resources on the client.
- Cache Category Menu – Set to YES. This ensures that the heavy processing of generating the navigation menu does not happen on every page load.
- Category Menu Cache Refresh Minutes – Set the number of minutes to keep the category menu cache active. This setting displays when you enable the Cache Category Menu setting. The default is 60.
Proactive Query Analyzer
The Proactive Query Analyzer (PQA) identifies queries that scale poorly before they slow a production site. PQA reports these queries even in a lightly used pre-production environment, so you resolve them before customers encounter slowness.
PQA checks Query Store, the SQL Server feature that records recently used queries and their plans. Each check examines the tables used, the WHERE clause, and index availability. From those characteristics, PQA determines whether a query degrades under high load or table growth.
View PQA findings
PQA logs potential issues as Info messages in the Nightly Maintenance job log. To keep the log readable, PQA limits the number of entries and gives precedence to the most concerning findings.
To see all findings, complete the following steps:
- Run the Generate Database Credentials action in Mission Control to get database access.
- Run the following query:
select convert(xml, query_plan) QueryPlan, Findings, Errors
from dbo.QueryPlanAnalysis
join sys.query_store_plan on query_store_plan.plan_id = QueryPlanAnalysis.PlanIdResolve PQA findings
Add an index to resolve most PQA findings. The query plan returned by the query in the previous section often includes a specific index recommendation.
- When the index applies to an extension table, add it as part of a deployment.
- When the index applies to a Configured Commerce base table, contact Optimizely to request the index in a future release.
Other findings require a query or schema redesign. For example, a query based on the CustomProperty feature frequently appears as a PQA finding. To resolve that finding, migrate the affected data model to a fully custom table instead of the CustomProperty feature.
Client-side considerations
- Google Chrome browser tools (Ctrl-Shift-I) can help you track down front-end performance issues. In particular, the Time column on the Network tab shows the time for each resource or API call to be returned. Sorting by Time shows the slowest items first. Filtering to XHR shows only the REST API and template calls that are happening. The Waterfall column shows what resources are blocking others. Etag caching should be visible in the browser tool when the items have Size listed as (from disk cache).
- You can export the browser tools network data on a page by right-clicking and selecting Save as HAR with Content. You can view the HAR file with a tool such as HAR analyzer or submit it as part of an Optimizely Support ticket.
- You must bundle and minify the CSS and JavaScript, which is the default for release mode. Few JavaScript and CSS downloads should display in the browser developer tools.
- To debug individual JavaScript or CSS files on a .NET site, append
?bundle=falseto the page URL. The page serves each file separately instead of bundles. Remove the parameter after debugging to restore bundled delivery. - Web fonts can affect client performance. Remove any unused fonts and optimize those that are in use. See Optimize webfonts.
- You should keep image files as small as possible.
- The navigation on the Product List page can cause browser slowness if hundreds of attributes are rendered, which can happen when the Search_FilterOnSearch > Show Attributes On Search is set to YES so that searches combine attributes from many categories. You may need to limit the number of attribute types displayed by reducing the Search_MaximumFacets > Maximum Attribute Facets setting to a lower number than the default of 1000.
Monitor API performance
You can monitor the performance of individual API calls in real time to aid in triaging performance issues using Application Insights. For example, you can see a dependency map that shows the amount of time spent in third-party APIs verses the Commerce APIs. This lets you see where you incur slowness.
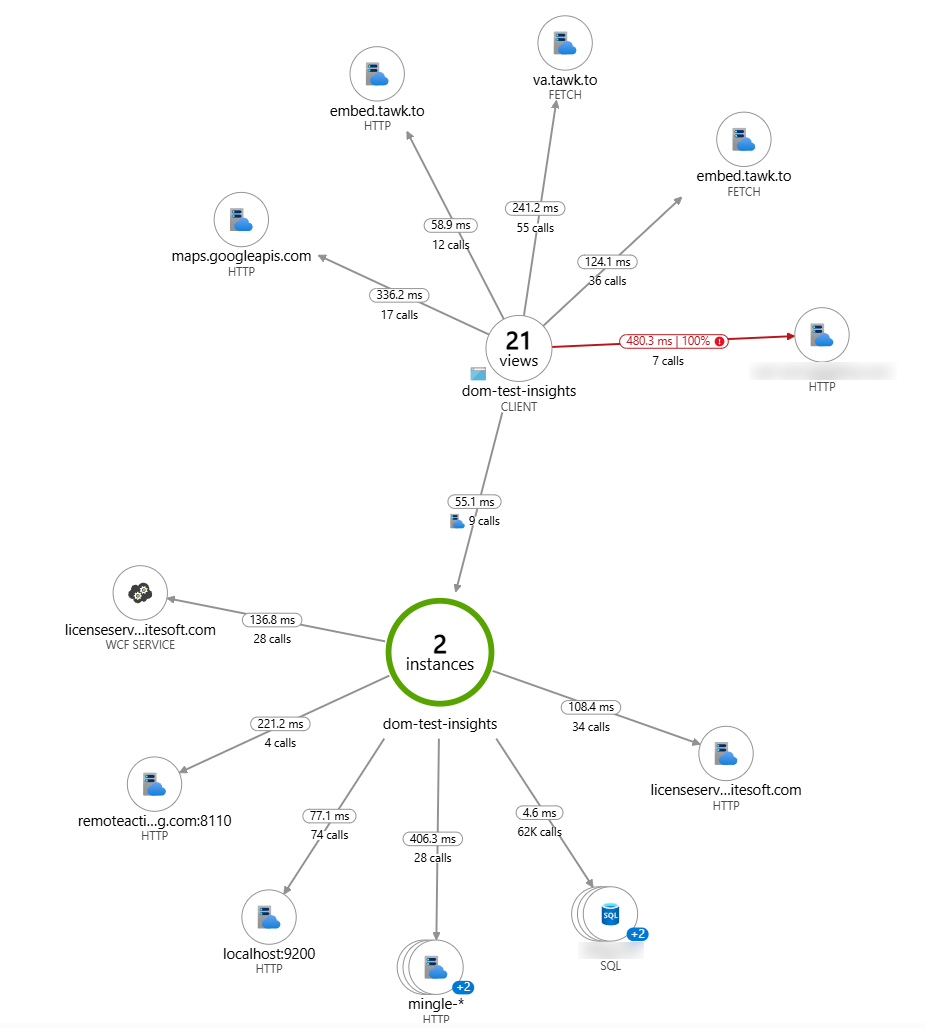
Configured Commerce provides the following support for Application Insights in versions 5.2.2411+:
- At-a-glance dashboard
- Query logs and metrics
- Alert rules
- Application map
- Availability tests
- Performance
- Overview and analysis
- Establish baseline
- Measure improvements
- Troubleshooting
See Add Application Insights in .NET to implement it.
Updated about 1 month ago