Go-live performance spot check
Describes how to test site performance prior to the go-live process in Optimizely Configured Commerce.
During project implementation, the partner tests and monitors site performance in QA and development environments, looking for site-specific data or custom code that could cause performance issues. A few weeks before go-live, as part of the Cloud Customer Launch Checklist, Optimizely performs a spot check of the site performance in sandbox to help ensure a successful launch. These tests place a subset of the site under load typical for other Configured Commerce sites.
NoteOptimizely does not perform performance profiling for existing projects on an ad hoc basis. Performance profiling is only performed for new projects before go-live.
If performance issues arise after go-live, Optimizely and the Partner can work together to resolve the issue through a support ticket separate from the go-live spot check ticket. Catalog-only sites will not be profiled.
Test steps
- Log a Zendesk ticket to schedule a performance profile test. Optimizely requires 2 weeks’ notice to begin the test. If there is an influx of tickets, then Optimizely works with you to appropriately prioritize and not impact delivery dates. Add any information about performance tuning you have already done and/or communicate any known performance concerns in the Zendesk ticket.
- Check-in all custom extension code into Github.
- Run
webpagetest.org. This simple process ensures that glaring issues such as large images are handled. You should run Google Lighthouse when runningwebpagetest.orgbecause it is more comprehensive and gives the user an overall score.
Once you complete the above steps, the Optimizely testing engineer schedules the performance profile testing. Testing takes between 1- 3 days to complete.
- Optimizely builds the Gatling scripts, using your custom code against the customer site and feature set (noted below) in the sandbox environment.
- The tests test the home page (authenticated and unauthenticated), up to three catalog pages, a product detail page, and adding to cart and checkout. This hits most of the APIs.
- Optimizely executes the Gatling scripts with a moderate load by running all of the tests mentioned above at the same time.
- Optimizely synthesizes the results and performs the due diligence for recommendations on data outliers.
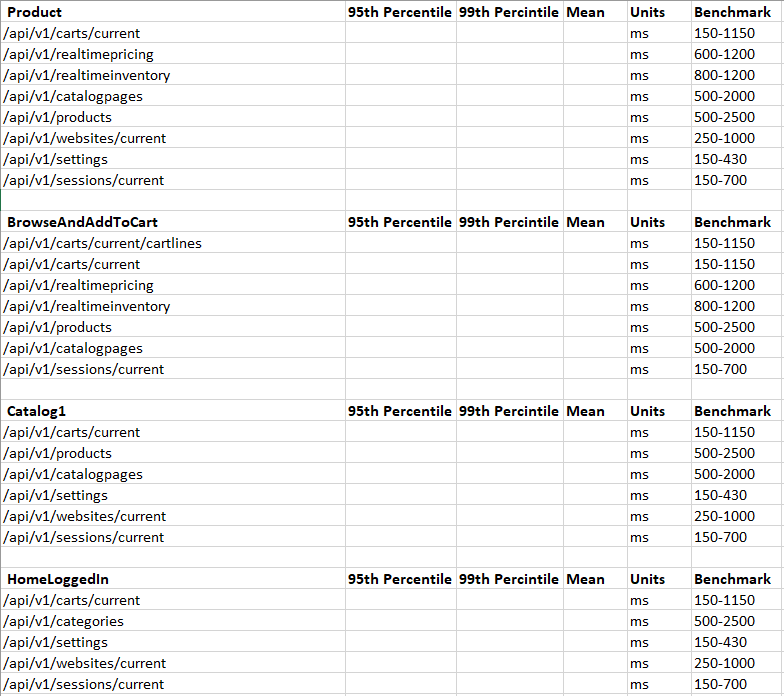
The final report includes timings for everything, including the APIs, but Optimizely only evaluates the APIs.
NoteTemplate for Performance Profile
Performance Profiling requested for: >
Performanc
Sandbox URL:
Targeted Go Live:Storefront User Username:
Storefront User Password:
Scoring and benchmark times
An evaluation is given for each benchmark:
- Marked as bad if the 99th percentile exceeds the upper threshold of the benchmark.
- Marked as good if the 99th percentile is within the benchmark and the mean is lower than the benchmark
- Marked as normal if both the 99th percentile and mean are within the benchmark.

General performance guidelines
If the results of the test highlight areas of poor performance, Optimizely's built-in metrics may be useful in narrowing down the source of the performance bottleneck.
Some other performance recommendations:
- Use
IQueryable<T> GetTableAsNoTracking()instead ofIQueryable<T> GetTable().
Inside Handlers and Pipelines, the developers are given access to IUnitOfWork, which exposes IRepository. Using theIRepository.GetTableAsNoTrackingmethod to get the Queryable of the entity prevents the potential overhead that Entity Framework entity tracking can have. - Avoid iteration load loops when working with
IUnitOfWork(or Entity Framework). This is especially true when iterating off of the GetTable() which has change tracking still on. If you cannot avoid this, break large loops of entities into smaller chunks. Otherwise, the performance in the loop will start fast and quickly degrade the deeper into the loop it gets. - Make strategic choices when using Lazy Loading over Eager Loading of Entities.
- The cost of Lazy Loading is the trip from the webserver to the database server and back. A common anti-pattern to look for is n+1 queries. The expense of lazy loading is hidden during local development when the database and web server are on the same machine, making the trip to and from under 1 ms and not noticeable.
- The cost of Eager Loading is the load and performance hit of the complexity of the join query itself. This can be especially noticeable when the Entity Framework query generated is not taking advantage of existing indexes/keys.
- Optimize Linq queries. Entity Framework is the ORM and allows rapid development. Just like you must optimize SQL queries to keep code performant, you must also apply that same optimization level to the Linq statements that generate SQL queries behind the scenes.
- Tooling to profile Linq to Sql:
- Sql Profiler – built into SQL Management Studio
- Glimpse –
https://github.com/Glimpse/Glimpse - Stackify/Prefix –
https://stackify.com/prefix/ - MiniProfiler with EF extension –
https://miniprofiler.com/andhttps://miniprofiler.com/dotnet/HowTo/ProfileEF6
- Tooling to profile Linq to Sql:
- Make strategic choices when using Expands during API calls. The expand API parameter tells the API to fetch deeper levels of data, which can be expensive. For example,
?expand=CustomPropertieson the products API retrieves all custom properties and values on each returned product. If you just want a list of product names and do not need the custom properties, this is an unnecessary performance hit.
Updated 8 months ago
