Troubleshoot DXP
Describes general service monitoring and how to enable debugging, logging, and detailed error messages for troubleshooting solutions based on the Optimizely Digital Experience Platform (DXP).
CautionYou should debug code only in the Integration environment. You should debug in the Preproduction/Production environments only when absolutely necessary. Contact Optimizely to submit a support ticket for remote debugging.
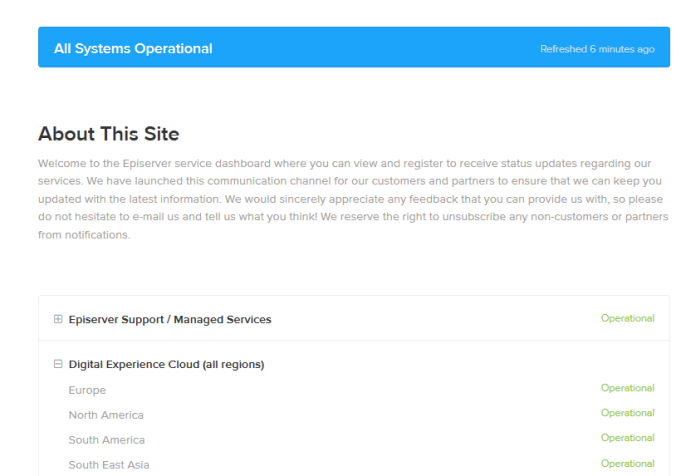
Check service status
Visit the Microsoft Azure Status dashboard for general service operation information. See the Optimizely service dashboard for Optimizely-specific operational status.
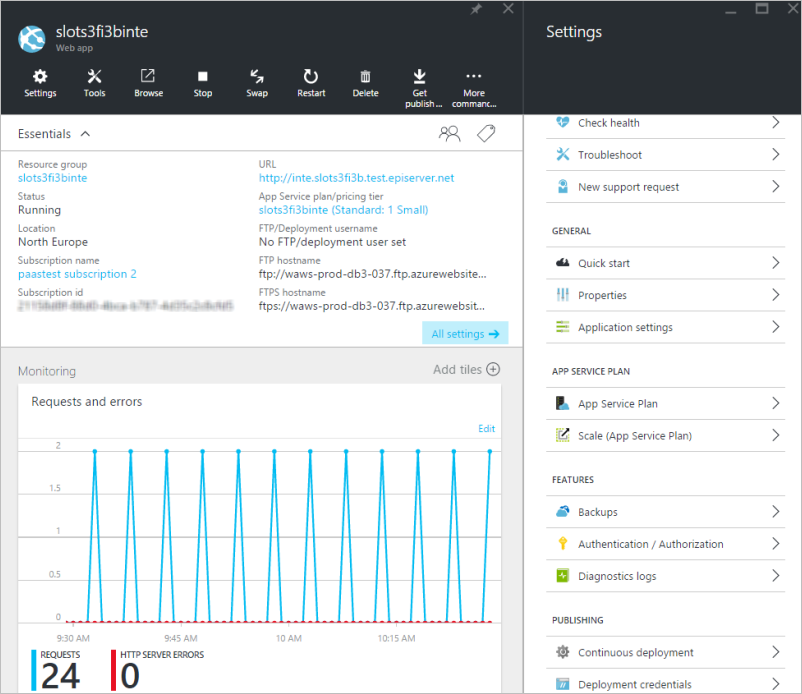
Access Azure Portal
Contact Optimizely to get access to your DXP-specific resources in the Azure portal so that you can monitor and troubleshoot your solutions. When logged in, the Azure portal will display information as in the example below.
Enable debugging
You need to enable debugging in the Azure Portal and Visual Studio. You first allow remote debugging in the Azure portal and then attach it to the correct process in Visual Studio.
NoteSee Microsoft’s Remote Debugger Port Assignments to ensure your remote debugger’s IP address is connected.
- In the Azure portal, select App Services.
- Select an Integration environment from the App Services list.
- Select Settings > Configuration.
- Open the General settings tab and go to the Debuggingsection.
a. Set Remote debugging to On.
b. Set Remote Visual Studio version to the version being used. - In Visual Studio, select View > Cloud Explorer.
- Click the person icon to display your subscriptions.
- Select your subscription and click Apply.
- Select subscription > App Services >, right-click on the Integration environment (a subscription with an inte suffix), and select Attach Debugger.
ImportantIf a connection error occurs with the URL of the site being loaded, go back to the Azure portal, select Settings > Custom domains to obtain the IP address that is used by the URL. Add this IP address and the URL from the error message to the
hostsfile on the machine (located atC:\Windows\System32\drivers\etc\hosts). For example:111.111.111.111 INTESite.orgIf you get an error message—Unable to connect to the Microsoft Visual Studio Remote Debugger—fix this with the following procedure:
- Get the development machine's public IP.
- In the Azure portal, go to AppService > Networking > Access restrictions.
- Place the public IP on the allow list.
Then repeat step 8.
Activate logging
Optimizely supports writing to the diagnostics log using BLOB storage. See Log into .Net Diagnostics Trace for more details on how this works.
To activate the logging:
- Select App Services for the Integration environment, and go to Diagnostics log.
- Set the Application Logging (Blob) to On, select desired Level of verbiage, and select a storage account and container under Storage Settings.
- Click Save when done.

NoteThe Web App will restart when activating the logging.
Log information and Kudu services
Access the website log files in the integration environment using any methods described in this section.
Download log files
Use the download or FTP options available in Azure Portal under Diagnostics logs for the environment.
Kudu services tool
Azure websites have an associated "scm" service site, where you can run site extension tools. For DXP, the Kudu services tool is available with your access to the Azure Portal.
To access the service tool, you add an "scm" segment to the environment site URL, for example https://epvscms3p60ginte.**scm**.azurewebsites.net.
The service tool lets you access files for the site and display information in Optimizely logs available under site/wwwroot/appdata and logfiles/eventlog.


Enable detailed error messages
You might find it useful to turn on detailed ASP.NET error messages in web.config for your solution in the Integration environment as an additional debugging tool.
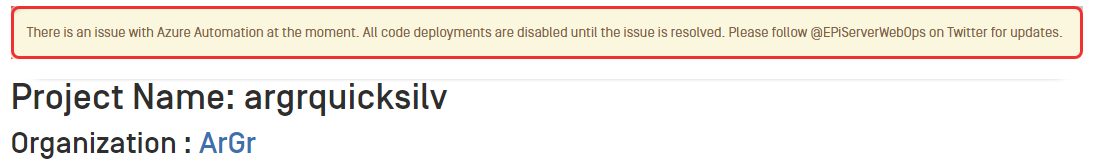
Deployments
Notifications may display at the top of the page sent by the system administrator. Also, support information is provided if you have issues during deployment.
An error message displays on the Project page if an unsuccessful deployment occurs.
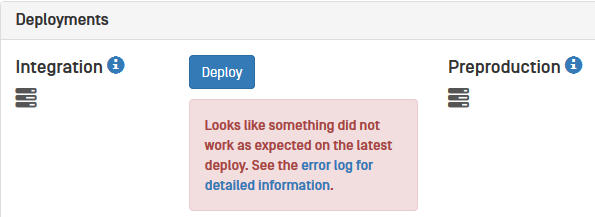
Click error log for detailed information to see a summary of the deployment issues.
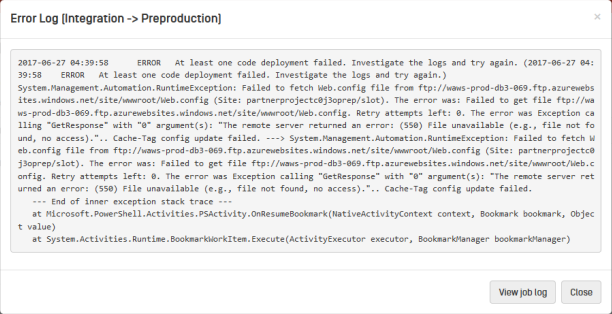
If the information cannot identify the issues, click View Job Log to open the Job output view. This contains detailed deployment information, as described in the following section.
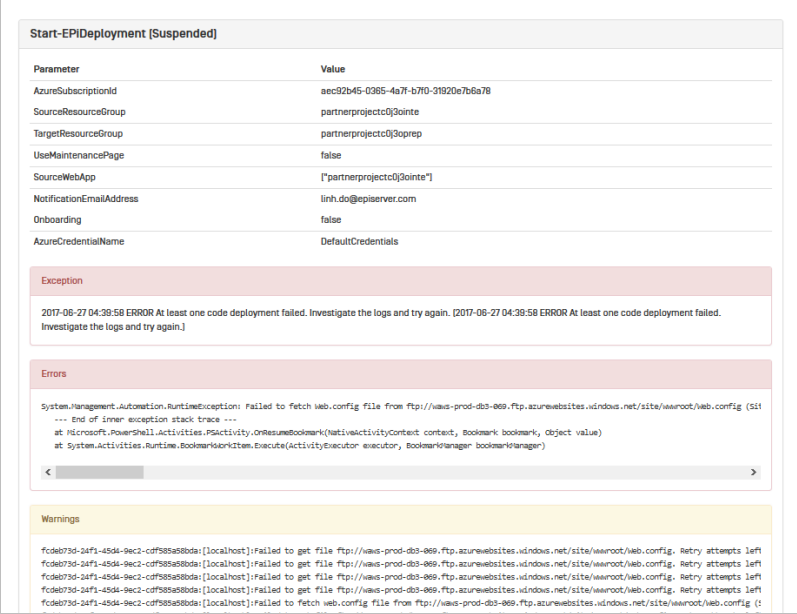
Deployment job log output
This view provides information about the sites and environments involved in the deployment. You can also find exceptions, error messages, warnings, and deployment output steps useful when troubleshooting deployment issues.
Click Get Detailed Logto receive the same information in an email. This is useful if you want to share the information with someone without access to the portal.

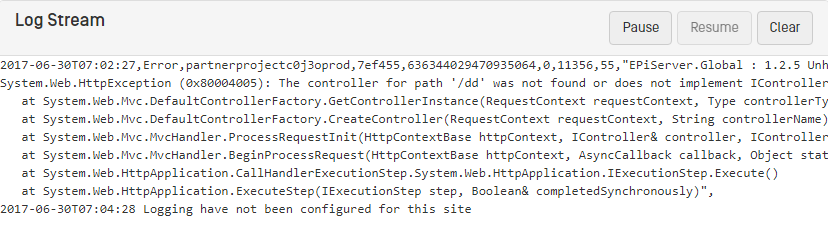
Log Stream
The Log Stream option lets you view output from Optimizely log files to help troubleshoot deployment errors. This option requires enabling diagnostics logging to a BLOB storage, as described in the article Enable diagnostics logging for Web Apps in Azure App Service.

Click Open Log Stream Window to access the log stream. You can hook on the Optimizely logs to monitor the live log stream from site instances. Click Pause or Resume to stop or continue streaming log information. Click Clear to remove the recent log output.
Related blog post: Setting up Continuous Integration with Azure DevOps and Episerver DXC Service (Optimizely DXP) by Stephan Lonntorp
Updated about 6 hours ago