Troubleshoot issues
Describes the steps to take if you need to troubleshoot Optimizely Web Experimentation or Optimizely Personalization.
Logging
You can tell Optimizely Web Experimentation or Optimizely Personalization to output its log to the browser's console log by using the query parameter optimizely_log={level}. For example, you can follow the high-level execution by adding ?optimizely_log=info. The following levels are supported, and the default is "off":
OFF– No logging.ERROR– Errors only.WARN– Warnings and errors.INFO– High-level information on campaigns, audiences, and event tracking.DEBUG– Detailed logging for debugging purposes.ALL– All logs.
Campaign activation
You can use the logging output to see which campaigns are activating for a given visitor and which experience they see.
First, enable logging by adding ?optimizely_log=info to a URL on your site. Then open your browser's console to see the logging output. To make the log more readable, it may help to filter within the console log to "Optly /" so that other messages are hidden.
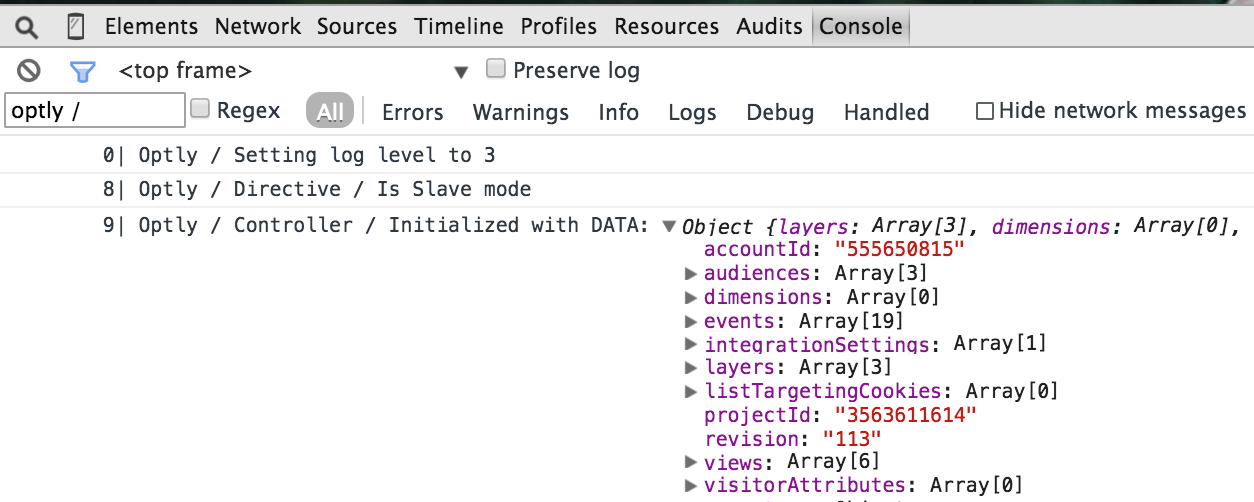
The first few lines cover the initialization of the Optimizely client, including data like the active campaigns, events, and pages. You can use this section to confirm that the right data is being compiled into the snippet. Some of the terminology is slightly different from the user interface:
- Experiences within a campaign are listed as
experimentswithin a layer, each of which has a singlevariationwith a set ofactions. actionsare the set of changes that apply for a specific experience on a particular page.
To debug a specific campaign, you can search within the console (Cmd-F) for that campaign's ID. You can find the ID in the URL of the Optimizely interface. A campaign with the URL https://app.optimizely.com/p13n/3563611614/layers/3558430129 has the ID 3558430129. Searching for this ID shows all log events related to that campaign. For example,
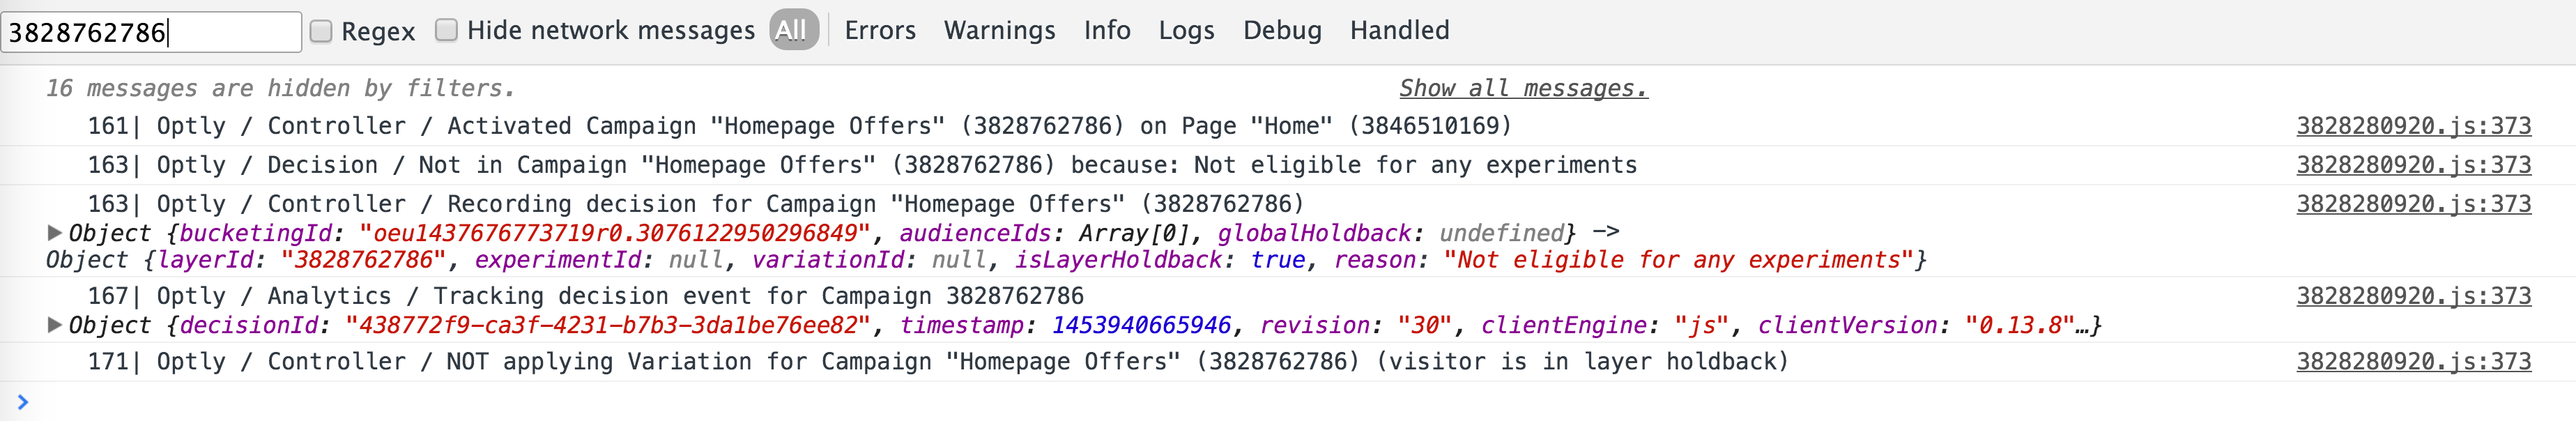
In this example, the output shows that the visitor did not match any of the audiences in the campaign. Therefore, they were not eligible for any experiences, and no changes were applied.
Add the visitor to a campaign audience to apply a change.
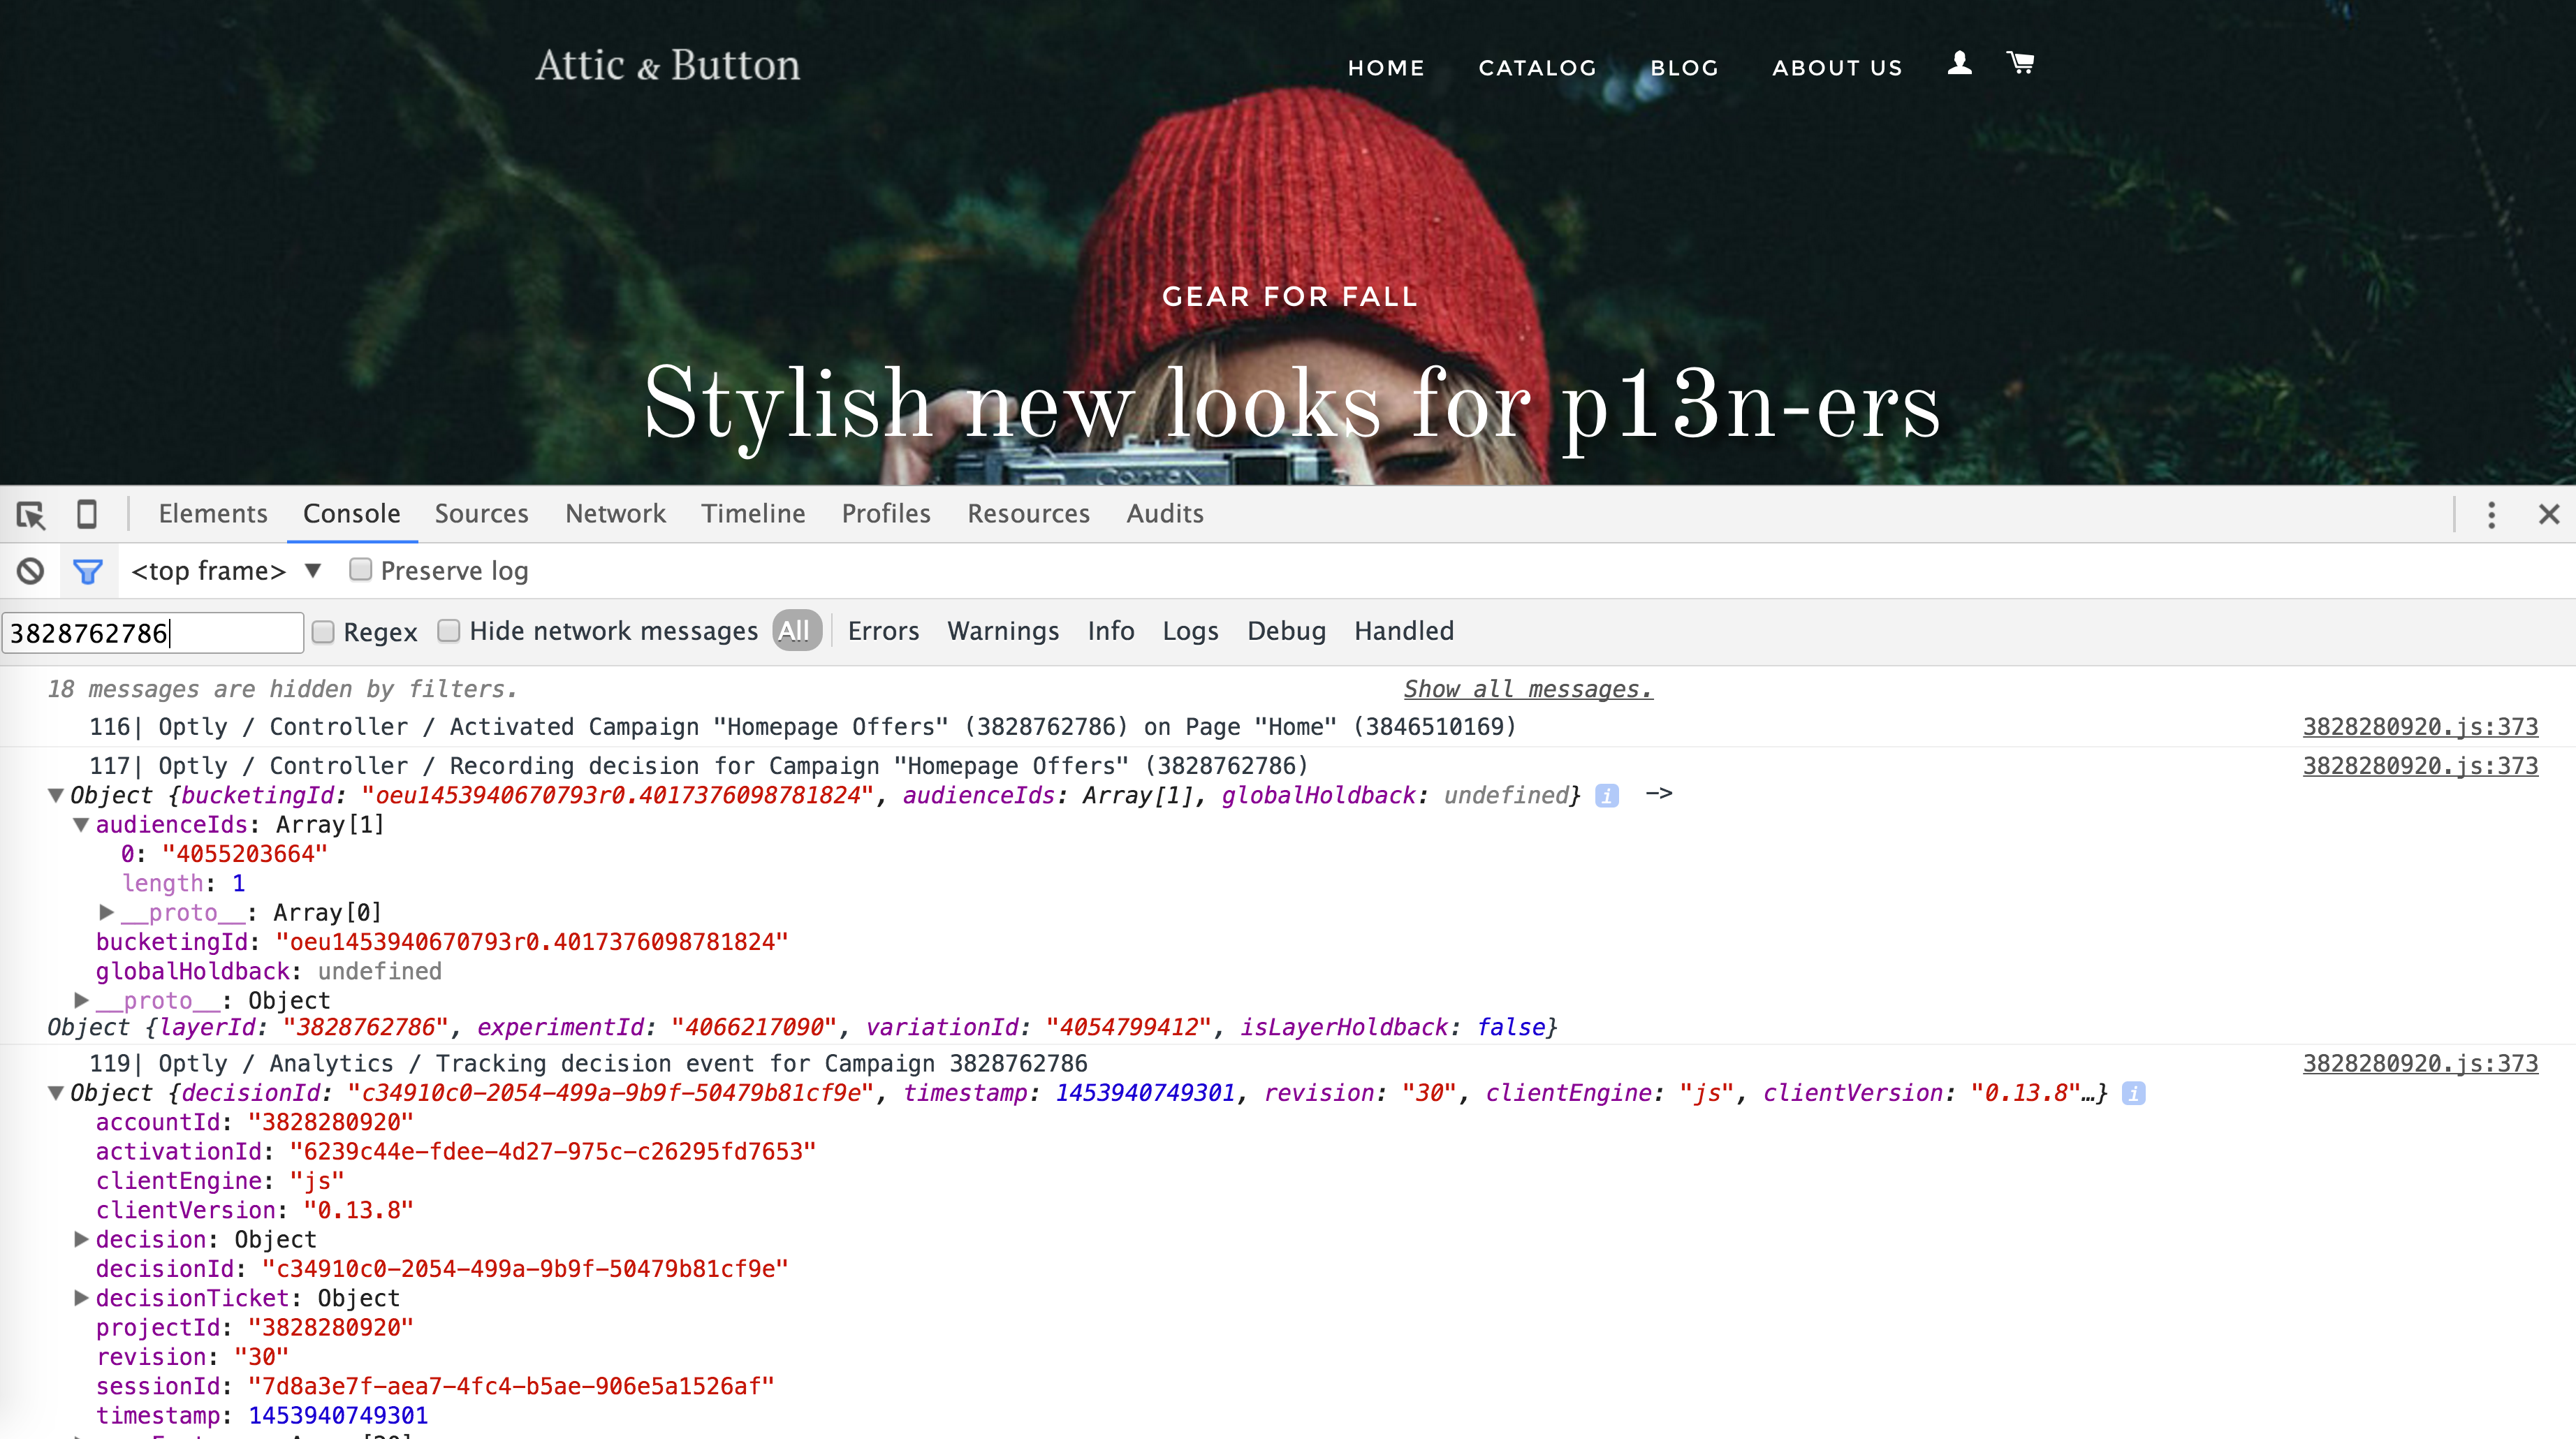
In this example, the output shows that the visitor was in the "Homepage Offers" campaign. The following are some of the entries in the log:
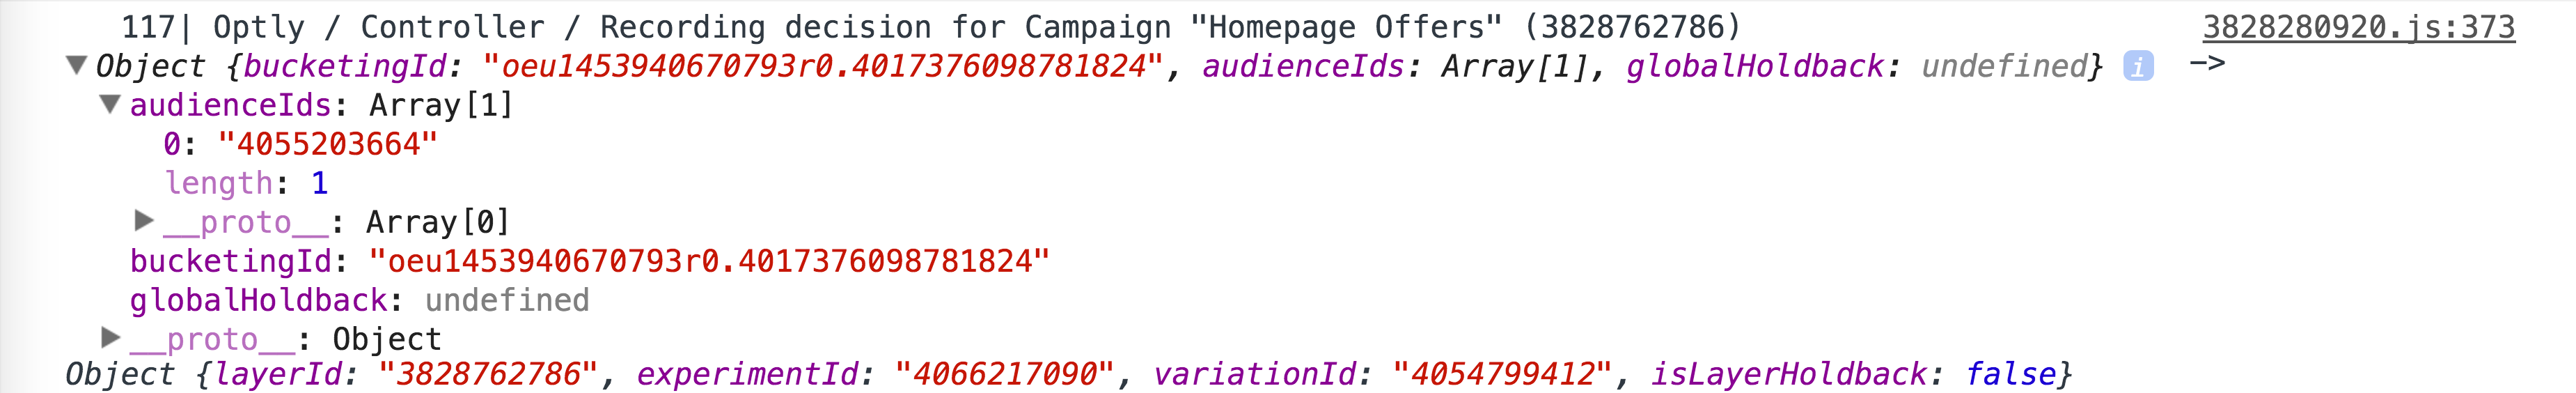
If you click on the objects in the log to inspect them, you can see some of the details about the decision ticket (the information Optimizely uses to make a decision about which experience to show) on the left side of the arrow -> and the decision (any selected experiment/variation and whether the visitor is in the layer holdback) on the right side. In particular, note the audienceIds property of the decision ticket, which shows the IDs of the audiences the visitor was in at the time of the decision.
You can see that Optimizely created a log event to track the decision. Inspecting the log event shows that it has properties decisionTicket and decision corresponding to the objects inspected above, as well as information about the client version, a guid, and timestamp to track the event in Optimizely's logs, and others (event properties subject to change).
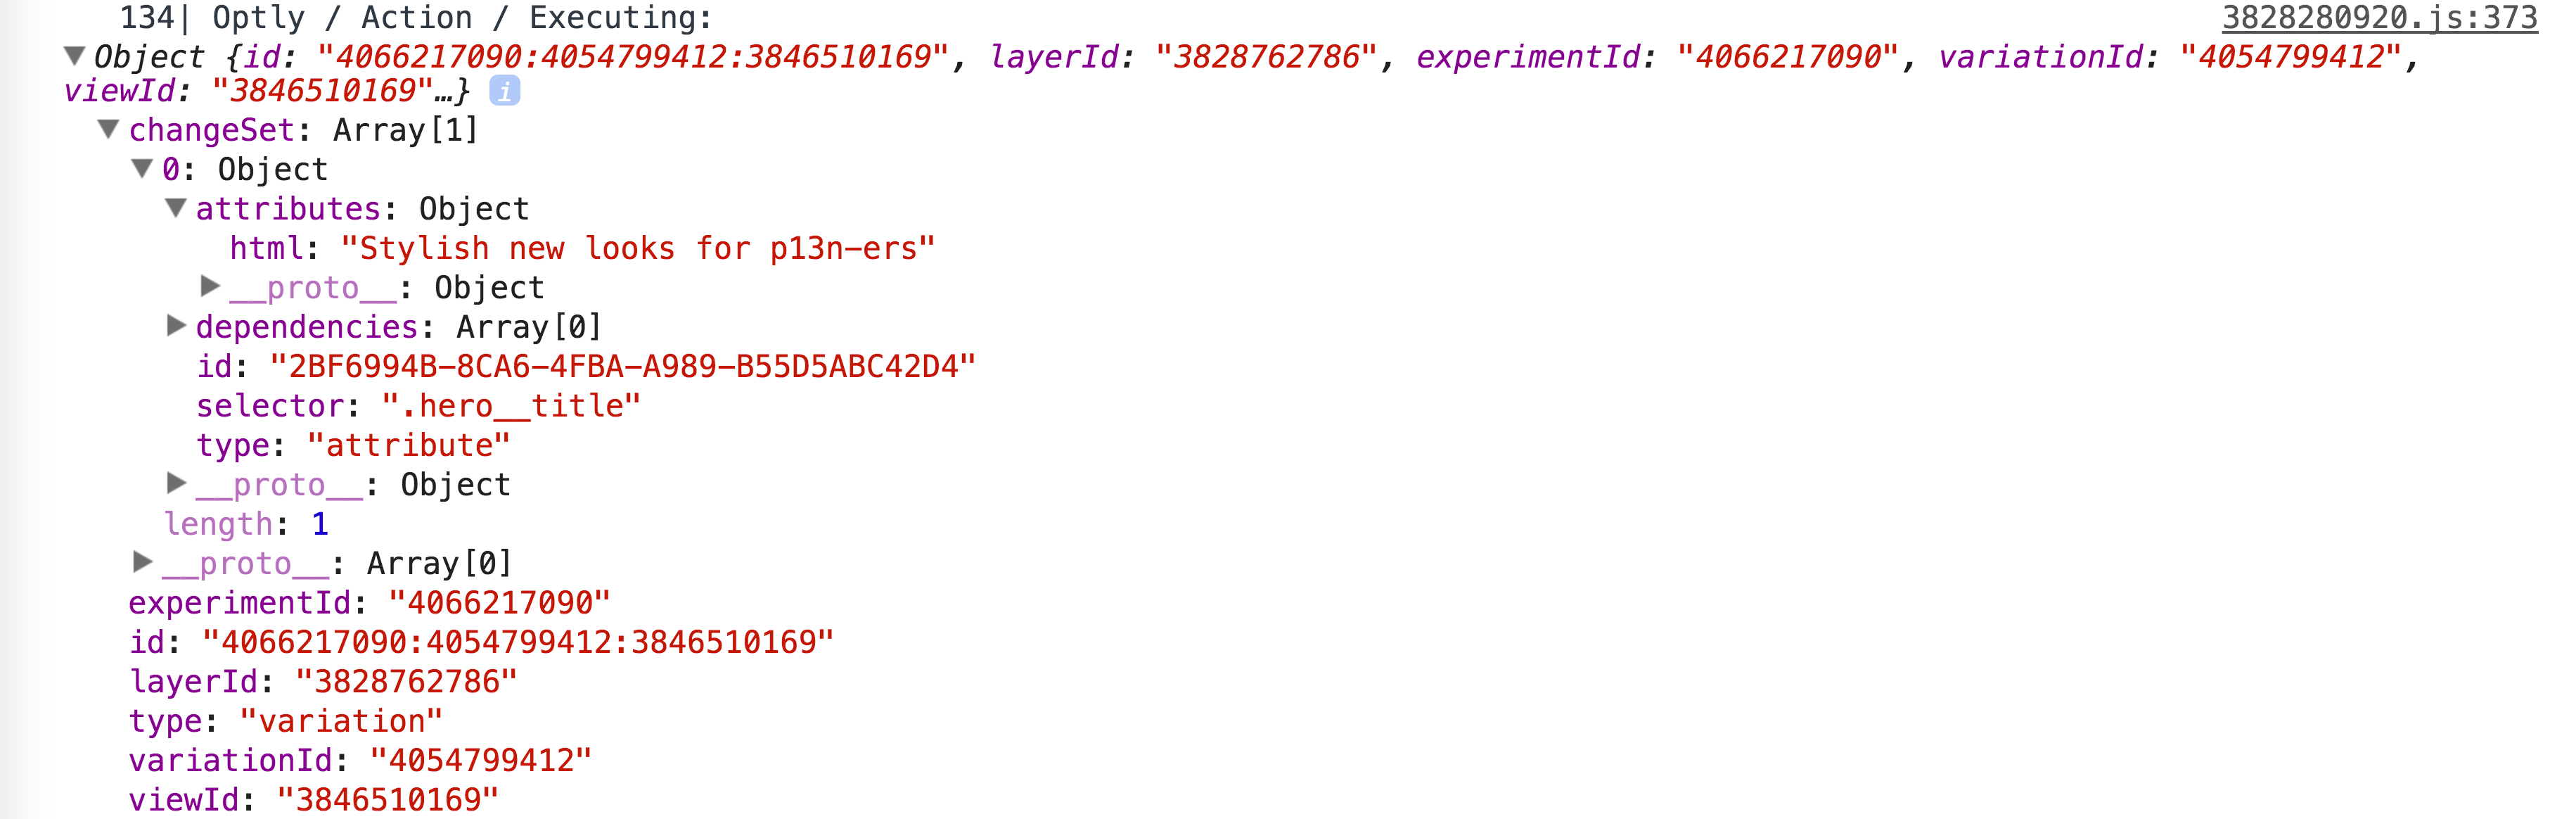
In addition to recording and tracking the decision, Optimizely applies the actions (changes) corresponding to the current view. Clicking on the object to inspect shows that the action is associated with the current campaign (layerId) and selected experiment/variation (from the decision) and consists of a changeSet (list of changes), each item of which describes a change to apply. The change detail above shows that the first change in the set is an attribute change that changes the html (innerHTML) of the .hero\_\_title element to the string Stylish new looks for p13n-ers. If an error occurs applying this change, it is logged here as well.
Events and tags
The process to debug event tracking and visual tags differs depending on the logging endpoint used by your snippet.
Snippets using the /events endpoint
/events endpointTo debug event tracking and visual tags, you can use the Network tab to observe requests to Optimizely's log endpoint. For example, in Google Chrome, you can open the Developer Tools then reload the page. When you click on the Network tab, you see all the network requests on that page. By filtering to logx, you can show only those requests made by Optimizely for tracking purposes. When you trigger an event (such as by clicking a button) you see it here:
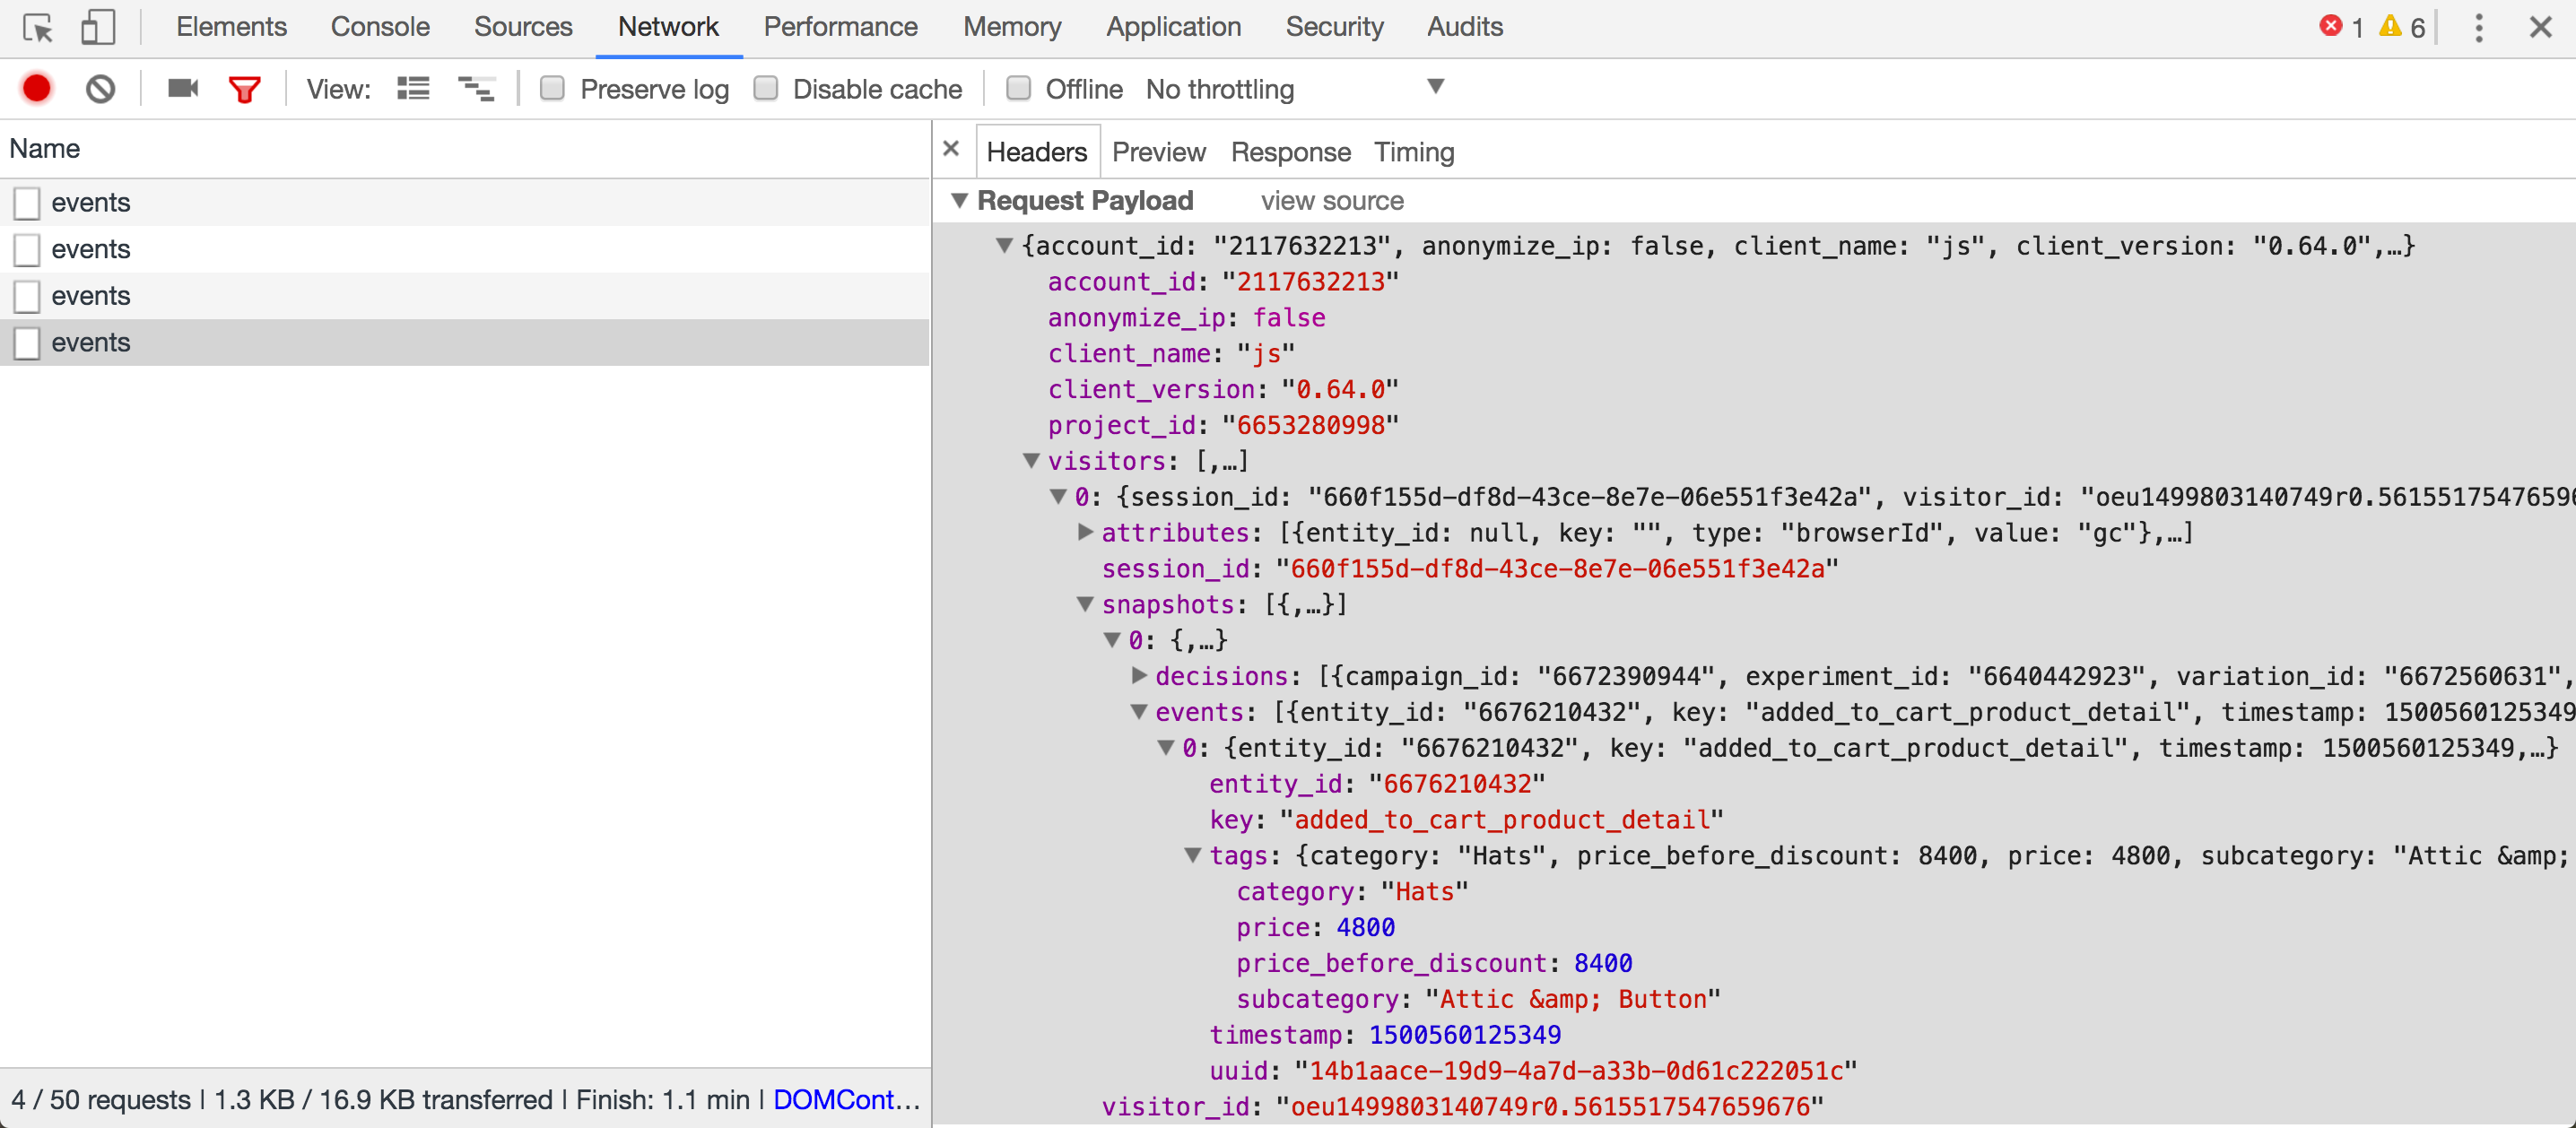
In this example, the Add to Cart button was triggered on the Product Detail Page (contained in the array of events included in this batch request). The key shows the API name of the event.
The tags object contains tag values captured at the time the event was triggered. This object is contained within each event object, and tag values can vary between the events in the request. This example has tags for the product's category, subcategory, and price. Finally, the decisions array shows which decisions were made so far for the visitor this session and which campaigns the event is attributed to.
For information on the structure of this request, see the Event API documentation.
Snippets using the /event endpoint
/event endpointTo debug event tracking and visual tags, you can use the Network tab to observe requests to Optimizely's log endpoint. For example, in Google Chrome, you can open the Developer Tools then reload the page. When you click on the Network tab, you see all the network requests on that page. By filtering to logx, you can show only those requests made by Optimizely for tracking purposes. When you trigger an event (such as by clicking a button), you see it here:
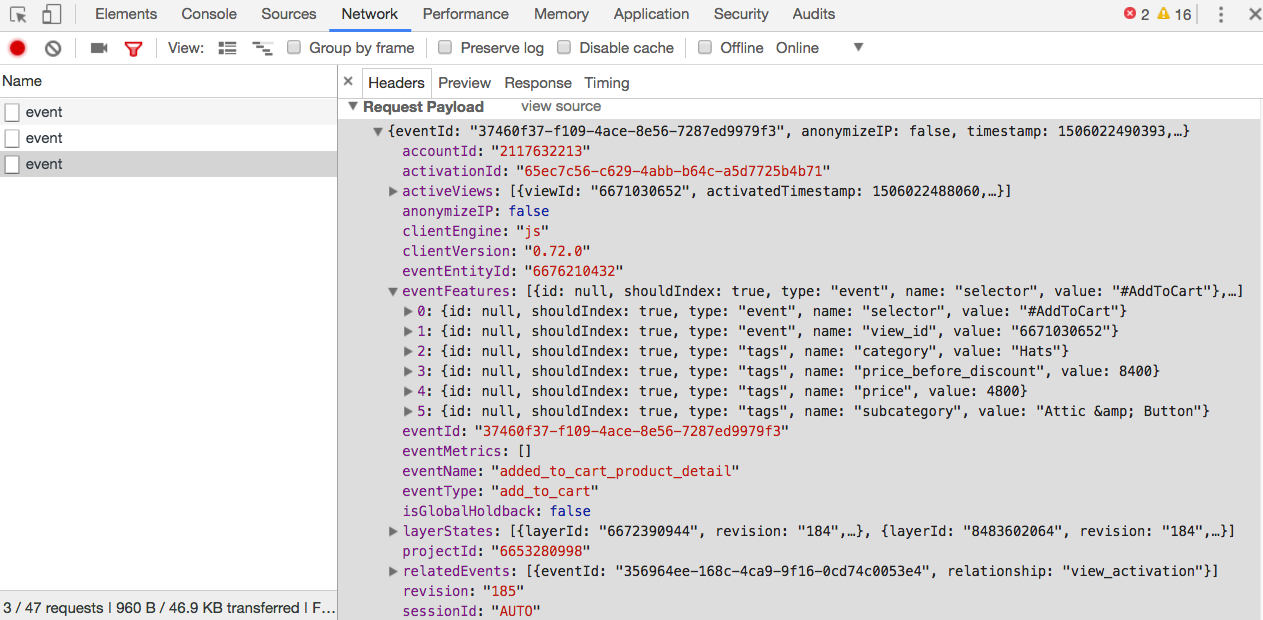
In this example, the Add to Cart button was triggered on the Product Detail Page. The eventName shows the API name of the event, and the type corresponds to the category in the Optimizely interface. For pages, eventType = 'view-activated' and the eventName are the page ID.
The eventFeatures show tags that were captured on the page. This example shows tags for the product's category, subcategory, and price. eventMetrics show tags used as metrics on the results page, like revenue for a custom event. The layerStates show which campaigns the event is attributed to.
Updated 3 months ago