Troubleshoot DXP
Describes general service monitoring and how to enable debugging, logging, and detailed error messages for troubleshooting solutions based on the Optimizely Digital Experience Platform (DXP).
CautionYou should debug code only in the Integration environment. You should debug in the Preproduction/Production environments only when absolutely necessary. Contact Optimizely to submit a support ticket for remote debugging.
Check service status
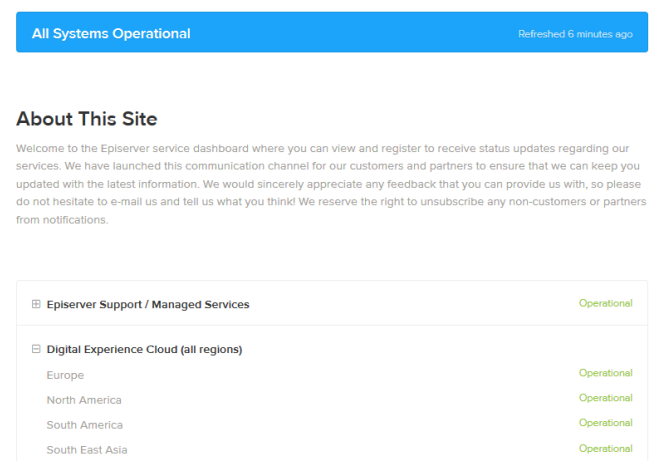
Visit the Microsoft Azure Status dashboard for general service operation information. See the Optimizely service dashboard for Optimizely-specific operational status.
Access Azure Portal
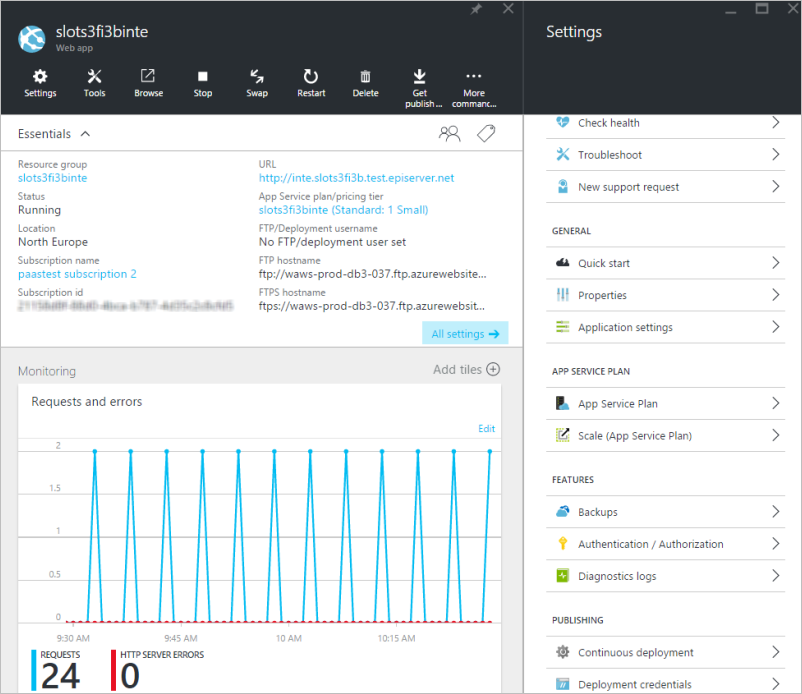
Contact Optimizely to get access to your DXP-specific resources in the Azure portal so that you can monitor and troubleshoot your solutions. When logged in, the Azure portal will display information as in the example below.
Kudu services tool and log information
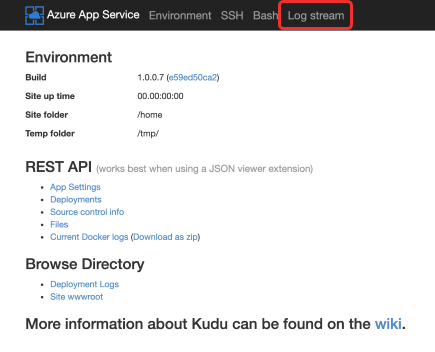
Azure websites have an associated "scm" service site, where you can run site extension tools. For DXP, the Kudu services tool is available with your access to the Azure Portal.
To access the service tool, you add an "scm" segment to the environment site URL, for example:
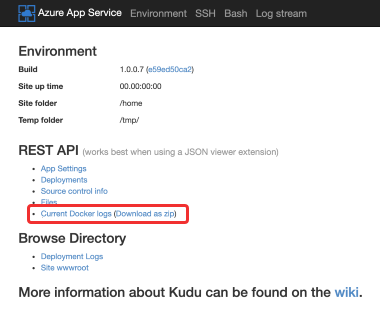
https://epvscms3p60ginte.scm.azurewebsites.net/The service tool lets you download the current docker logs or get access to the log stream.
Deployments
Notifications sent by the system administrator may display at the top of the screen. Support information is provided if you have issues during deployment.

An error message displays on the Project page if an unsuccessful deployment occurs.
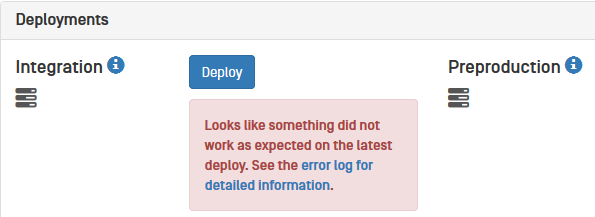
Click error log for detailed information to see a summary of the deployment issues.
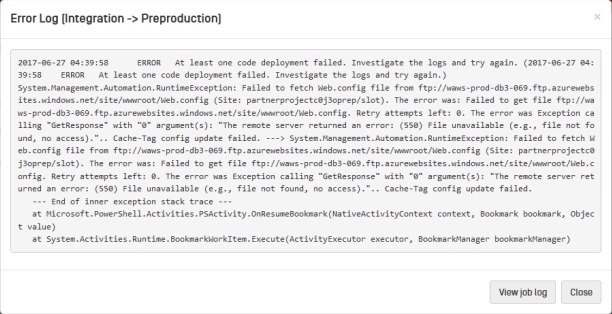
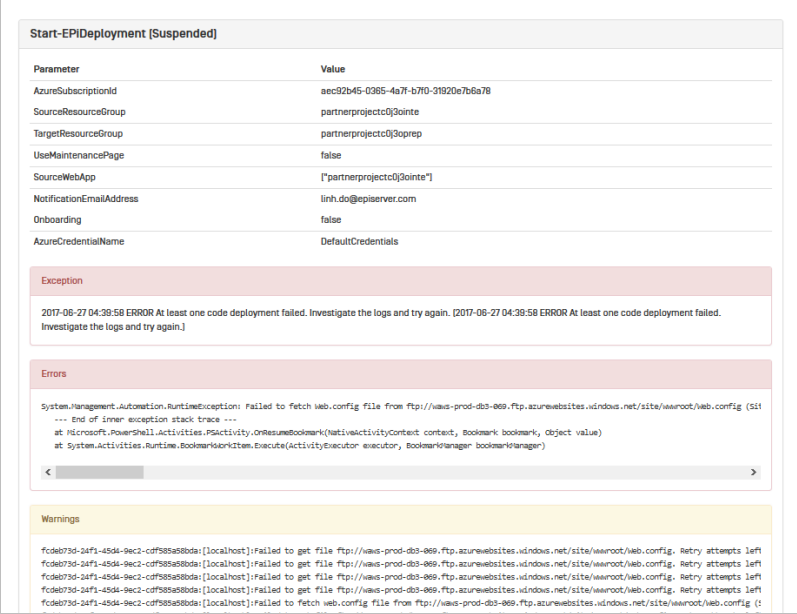
If the information cannot identify the issues, click View Job Log to open the Job output view. This contains detailed deployment information, as described in the following section.
Deployment job log output
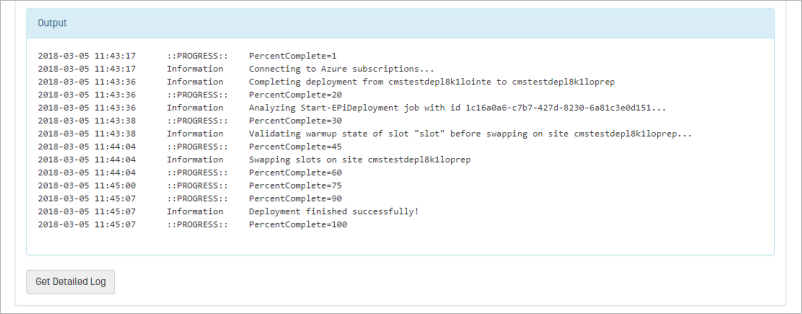
This view provides information about the sites and environments involved in the deployment. You can also find exceptions, error messages, warnings, and deployment output steps useful when troubleshooting deployment issues.
Click Get Detailed Logto receive the same information in an email. This is useful if you want to share the information with someone without access to the portal.
Log Stream
The Log Stream option lets you view output from Optimizely log files to help troubleshoot deployment errors. This option requires enabling diagnostics logging to a BLOB storage, as described in the article Enable diagnostics logging for Web Apps in Azure App Service.
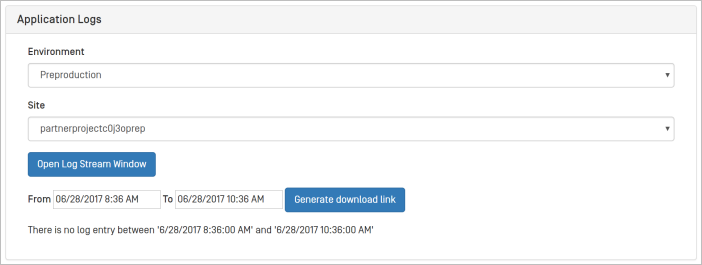
Click Open Log Stream Window to access the log stream. You can hook the Optimizely logs to monitor the live stream from site instances. Click Pause or Resume to stop or continue streaming log information. Click Clear to remove the recent log output.

Related blog post: Setting up Continuous Integration with Azure DevOps and Episerver DXC Service (Optimizely DXP) by Stephan Lonntorp
Updated 8 months ago
