Deploy changes in DXP manually
Describes how to access the DXP Management Portal, and the steps to deploy changes between the Integration, Preproduction, and Production environments with Optimizely Digital Experience Platform (DXP).
PrerequisiteYou need an Optimizely cloud account to access the self-services for Optimizely DXP. See Create an Optimizely Cloud Account how to get an account.
ImportantYou cannot use generic accounts like
[email protected], or private hotmail-type accounts like[email protected]. The self-deployment portal works best with browsers Chrome or Firefox.
Verify site access before deployment
Before starting a deployment, ensure the site in the source environment is running by accessing it in a browser. If the site has IP restrictions preventing you from navigating to it, ask the technical contact for the site to add your IP address to the exclusions list.
If you cannot reach the site, something is probably wrong, and deployment cannot be done. Contact the technical contact for the site to solve the issue, and try again. When you have verified site availability, you can start the deployment.
Deploy from Integration to Production environments
This example deploys from the Integration to Preproduction environments, but the procedure is similar when deploying from Preproduction to Production.
-
Go to the DXP Service management portal on
https://paasportal.episerver.netand log in with your account credentials. The Organizations section displays.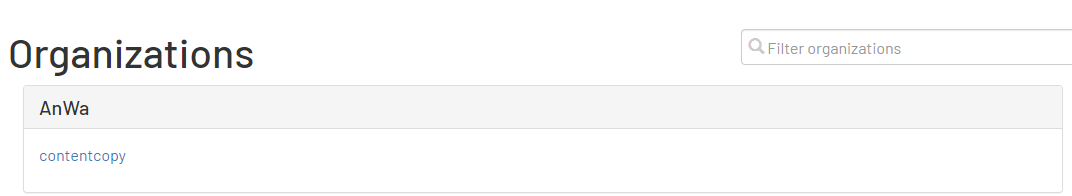
-
Locate the organization and project you want to deploy changes for, and click on the project name to open it.
-
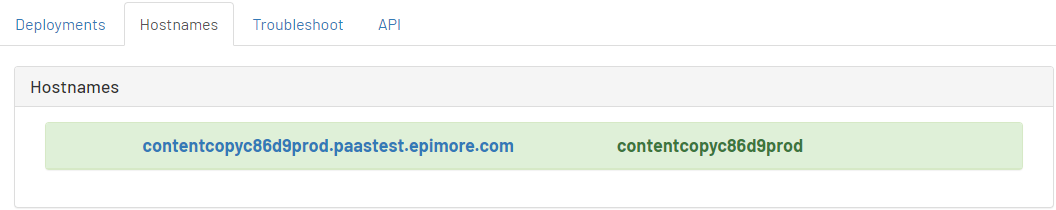
Click the Hostnames tab to see available hostnames.
-
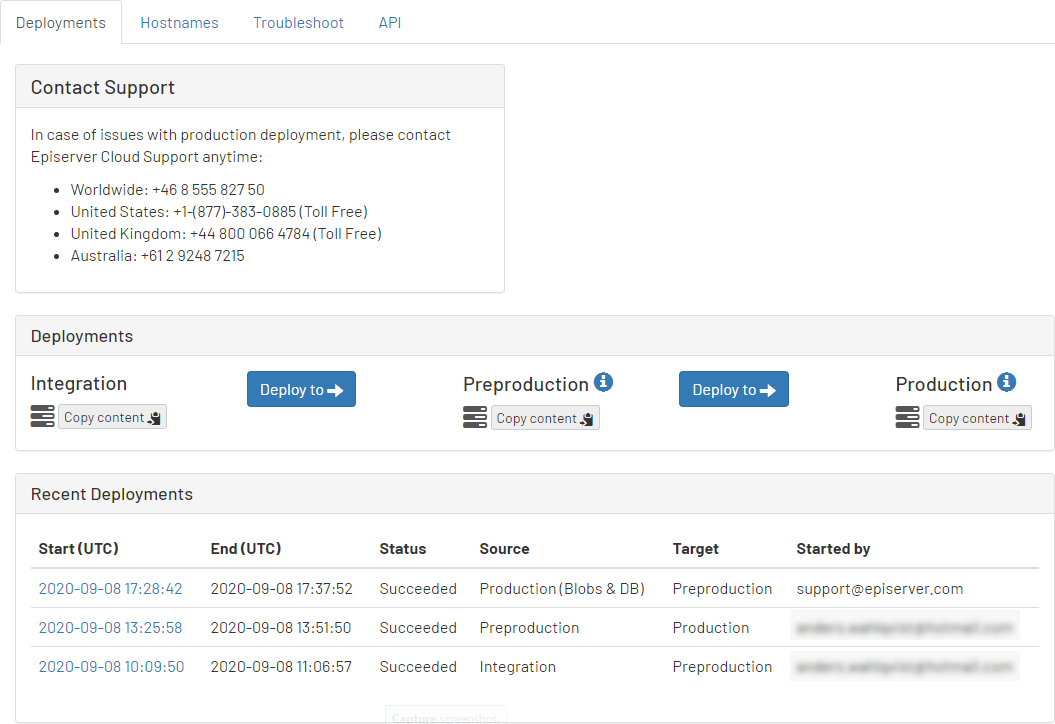
Click the Deployments tab of the Project page; it provides contact information and deployment options.
-
Before deploying, verify that the source site works by viewing the application logs (Troubleshoot-tab > Application Logs). If the site works as expected, click Deploy to start the deployment.
-
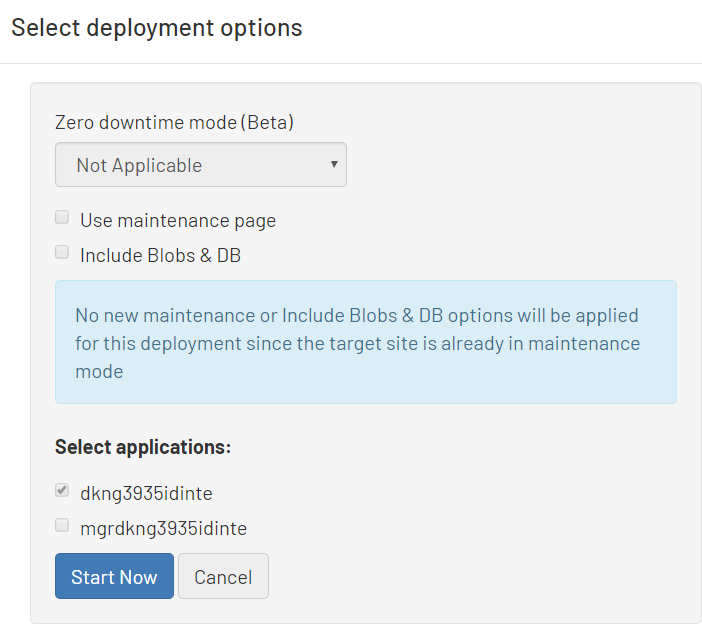
Select the applicable options in the dialog box that displays:
If you use Zero downtime mode, the Use maintenance page checkbox is automatically checked. A maintenance page is used only for sites that do not support Zero downtime mode or where it does not make sense, such as for scheduler web apps or Commerce Manager.

- Zero downtime mode – Select one of the following. See also Smooth deploy.
- Not Applicable – Select this option to prevent using Zero downtime mode.
- Read Only – (Recommended) The cloned site runs in ReadOnly-mode, so no changes are applied to the temporarily cloned copy. No data loss occurs during the deployment.
- Read Write – (Data loss likely) The cloned site runs in ReadWrite-mode and lets data be written to it.
Warning
Any data written to the cloned database while the deployment is running will be lost at the end of the deployment. The ReadWrite mode increases compatibility with more features and add-ons, but should be used only when data loss is acceptable for the site. (You should make editors aware that no updates should be made to the site during this phase of the deployment.)
- Use maintenance page – If the deployment includes database schema updates or changes to content types, select to display a maintenance page while the site is offline.
- Include Blobs & DB – If it is a first-time deployment to the target environment, select to copy these items over. Existing BLOBS and database are overwritten if you select the Include Blobs & DB option. If this option is not selected, only code will be copied.
- Select applications – If you have multiple web applications, you can select which ones to deploy.
-
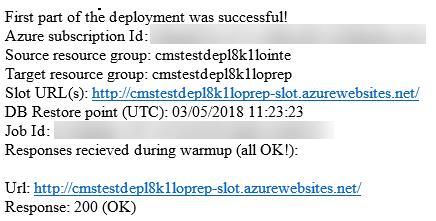
Click Start Now. A progress bar displays the progress of the deployment. When the first part of the deployment is done, a confirmation message displays in the portal.
- Click View output log to see the details of the deployment step.
- You can click Cancel to stop the deployment and roll back the changes if needed.

-
Click the Preview... link to verify that the sites in the slot are working as expected.
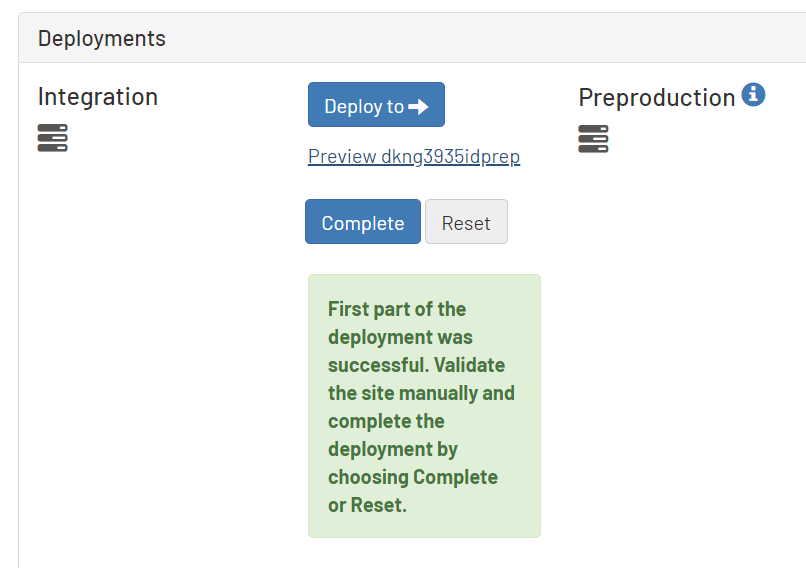
An email is also sent to the technical contact for the target site, with links to the slot URLs that you can use for site verification.
 Warning
DO NOT continue with the deployment if you cannot properly verify a site in a slot.
If there is a problem, you can fix the Integration environment and deploy it to Preproduction again, but the Use maintenance page or Include Blobs & DB options are unavailable. You cannot re-select the source applications; it auto-selects them from the previous deployment.
-
When verifying the sites in the previous step, click Complete to finalize the deployment. A progress bar displays, and the site in the slot is swapped into the Preproduction environment.
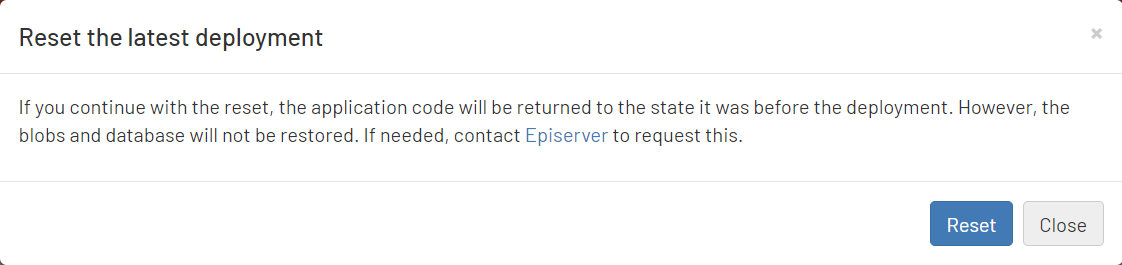
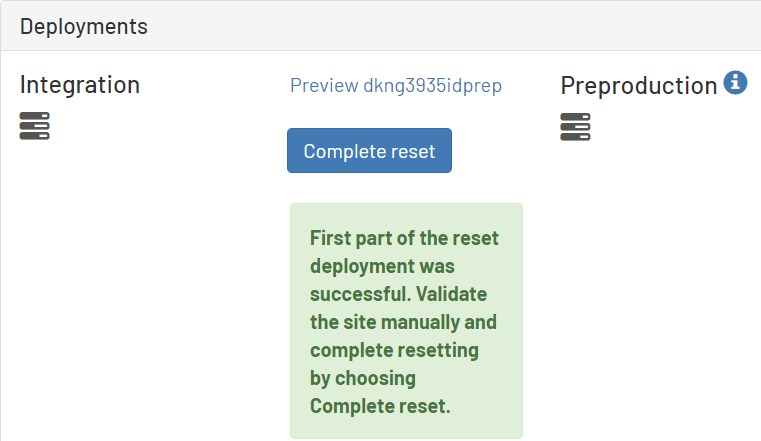
NoteAlternatively, if the deployment did not succeed, click Reset to revert the changes. The Preproduction environment is reverted to its initial state if a site did not work as expected in the first deployment part. Click Reset in the confirmation dialog box, to complete the reset, and go to the troubleshooting section below to solve the issues.
 Note
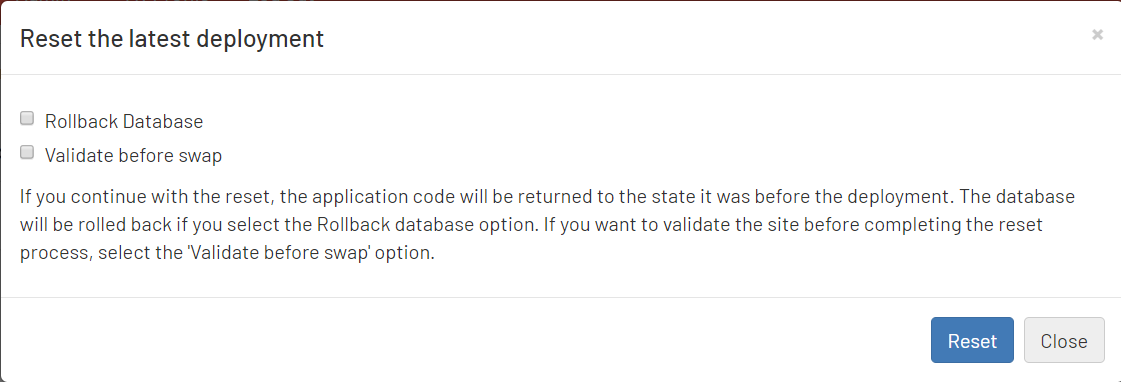
NoteIf you selected Use maintenance page, you can roll back the database and validate the Reset progress.
-
If you selected Validate before swap, click Preview to verify that the sites are working as expected after resetting, then click Complete reset to finalize the reset progress.
-
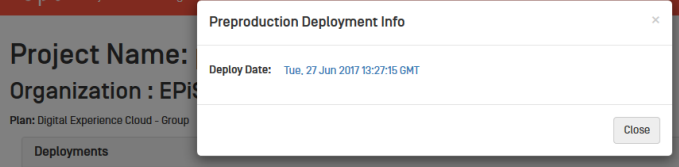
When completed, the project page displays the Deploy option again. You can click the information icon next to the environment name to see when the latest deployment was completed.
-
If the deployment succeeds, verify that the preproduction environment works as expected.
NoteTo troubleshoot deployments, see Troubleshoot DXP.
Updated 10 months ago