Consumption metrics
Describes the consumption metrics service, definitions, and usage parameters for solutions running in Optimizely Digital Experience Platform (DXP).
Setting the usage parameters correctly, especially for single-page applications, ensures the website traffic volume monitoring is correct.
You define the consumption levels when setting service tiers based on the estimated amount of generated traffic. The usage parameters measure the service consumption.
An example of a usage parameter is the view of a page on a customer website provided by a service instance under an Optimizely DXP subscription. A visitor clicking reload after reaching the page counts as an additional page view. A visitor going to a different page and returning to the original page records an additional page view.
You can see the consumption metrics and traffic volumes in Application Insight (requires access).
Usage parameter definitions
- Page view – Tracks page impressions. Every occurrence where a page is displayed to a visitor counts as a page view. For websites, page views usually correlate with events where the browser location changes, such as when a visitor clicks a link, navigates browser history, and reloads the current page or types in a new address.
Note
Bot traffic, that is not blocked by default Cloudflare WAF rules, is counted as a billable page view.
- Page – Compiles content that is not a static file but has a URL and can be loaded in a browser. Depending on the implementation, a page may map to an instance of a page type in Optimizely Content Management System (CMS) or to a product in Optimizely Customized Commerce. Still, it may also include blocks, external data, or aggregates of external data or other pages.
- Static file – Contains an uploaded or deployed file, such as a PDF, image, or CSS with a URL, and can be downloaded as-is by visitors.
- Visits – Tracks site entry requests for frontend hosting solutions. Optimizely uses Cloudflare Zone Analytics to calculate visits. A visit is an HTTP request that returns an HTML response where the
Refererheader either is absent (for example, a direct URL, bookmark, or typed address) or does not match the site hostname (for example, a link from a search engine or another website). Visits do not include traffic blocked by the Web Application Firewall (WAF), and visits are measured at the CDN edge, not through browser scripts or cookies. One visit can include multiple page views within the same session.NoteVisits applies to frontend hosting only. It is a separate metric from Page view, which is sourced from Application Insights.
These parameters are the base of the usage metrics. Application Insight monitoring is configured automatically for sites running in DXP, but you may need further configuration to use its features fully, depending on the site architecture.
How visits are calculated
Cloudflare processes each incoming HTTP request at the edge before forwarding it to the origin server. For each request, Cloudflare records metadata including the IP address, requested URL, user agent, timestamp, and HTTP response status.
A request qualifies as the start of a visit when both of the following are true:
- The response is an HTML page, not a static asset such as an image, stylesheet, or script.
- The
Refererheader is absent or does not match the site hostname.
Cloudflare then groups subsequent requests from the same visitor into a single visit using heuristics based on IP address, user agent, and activity within a defined time window.
The following actions count as a visit:
- A user follows a link from a search engine.
- A user follows a link from another website.
- A user opens a bookmark.
- A user types the URL directly into the browser.
The following actions do not start a new visit:
- Navigating between pages within the same site.
- Refreshing a page (counted within the existing visit).
Single-page applications
Page views are tracked by default when a new page loads into the browser. Websites based on the Single Page Application (SPA) concept are different because these interact with visitors by dynamically rewriting the current page and do not need page reloading. You need to configure the page view tracking for these websites.
Application Insights is already loaded when the page loads with the following code to track a custom page view:
if (typeof appInsights !== 'undefined')
  {
    appInsights.trackPageView(myPageName);
  }
External frontend applications
If you are hosting your frontend application outside DXP Cloud Services, you can instrument and send client telemetry to Application Insights in DXP Cloud Services.
Fetch the Instrumentation Key from the landing page in Application Insights in the Azure Portal.
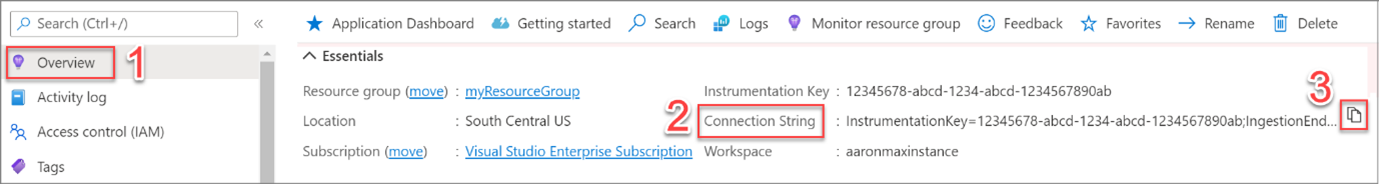
Follow the steps from Microsoft Azure to enable Application Insights.
Client telemetry
Application Insights tracks server telemetry through a JavaScript agent installed on the server but can also track client telemetry such as page views, session information, and general information about users. This is done through a JavaScript beacon injected on the site. This injection happens automatically on App Services for CMS 11 through the app setting APPINSIGHTS_JAVASCRIPT_ENABLED or through the NuGet package EPiServer.CloudPlatform.Cms on CMS 12. This sends the client telemetry to Application Insights and is retained for 90 days. Optimizely collects the page view data from each application insight instance in DXP and presents it through https://dxc.episerver.net/.
NoteIn CMS 12, make sure you have the
@Html.RequiredClientResources("Header")snippet in your site template, otherwise the necessary scripts for Application Insights might not be injected and the tracking will not work.
You can see this JavaScript in dev tools as ai.\*.min.js, depending on your current Application Insights SDK or injected by Microsoft into your web app. You also see a POST request called Track that sends the data to application insights at the address https://dc.services.visualstudio.com/v2/track.
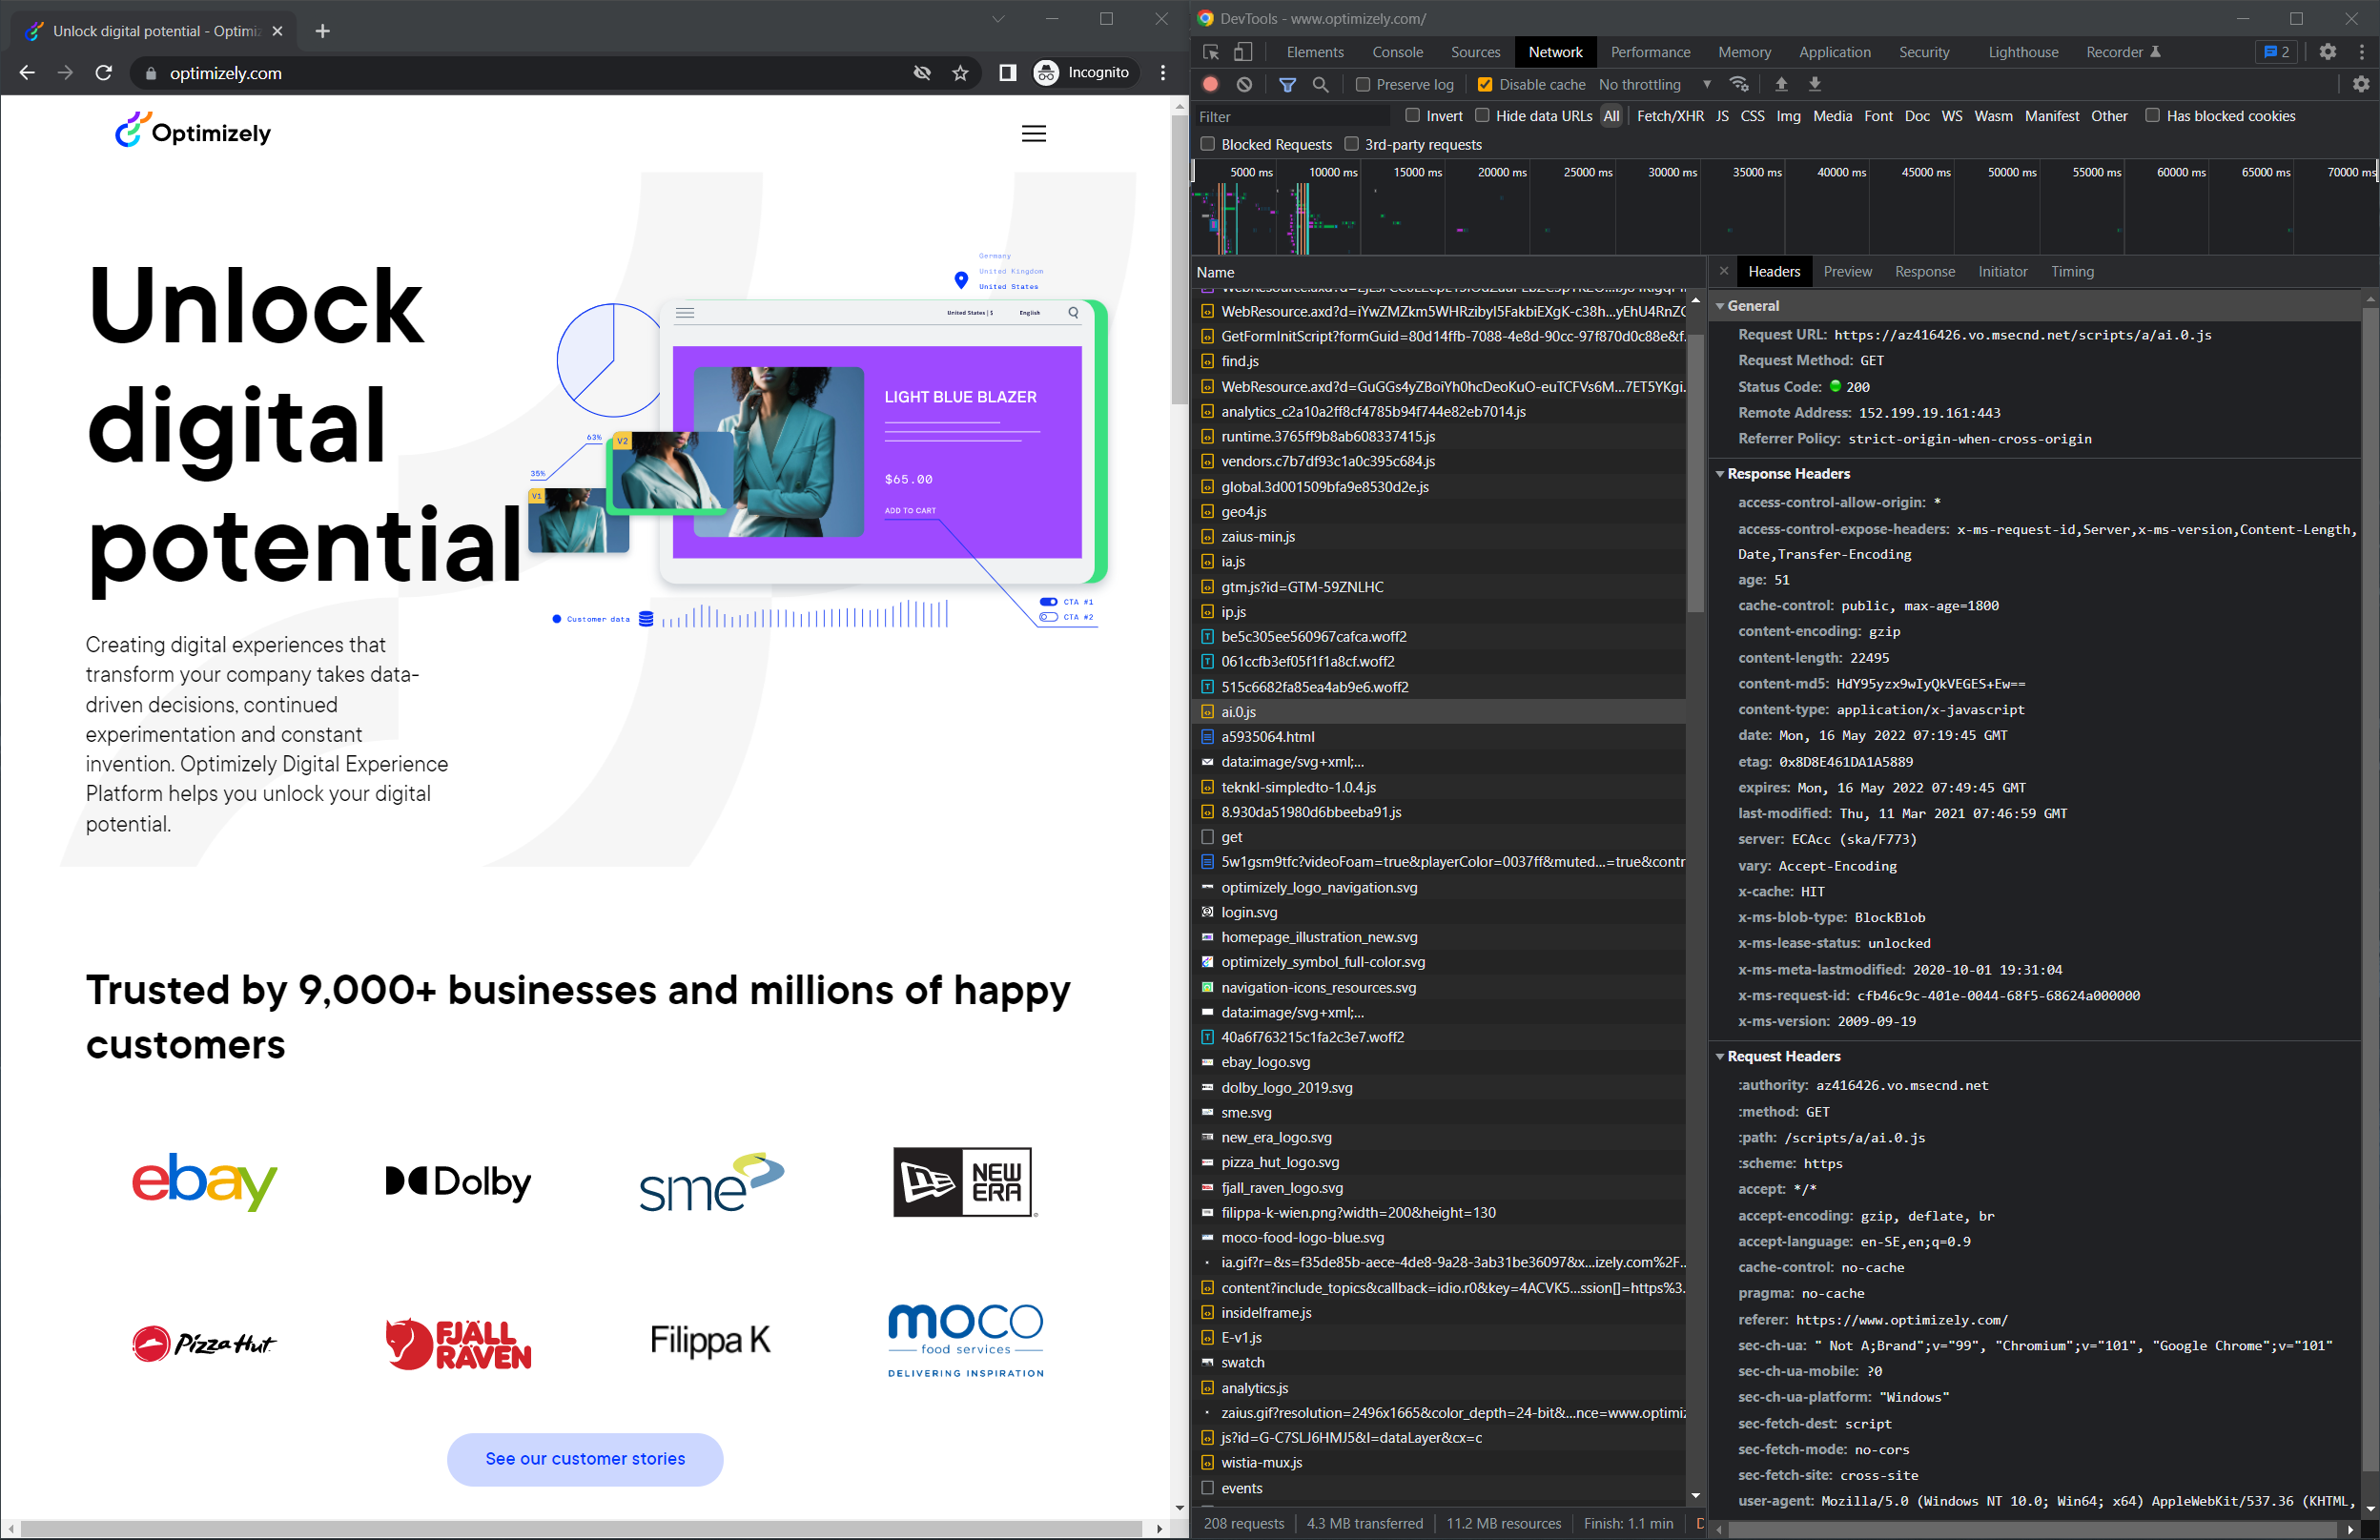
To contextualize the user, it injects two cookies called ai_session and ai_user and passes these values to Application Insights in the POST request.
 There is an application-wide option to turn off those cookies:
public void ConfigureServices(IServiceCollection services) {
    // services.AddCmsCloudPlatformSupport(_configuration);
    services.Configure<InstrumentationOptions>(o => o.DisableCookieUsage = true);
}
Or through appsettings.json
{
  "EPiServer": {
    "Cms": {
      "Instrumentation": {
        "DisableCookieUsage": true
      }
    }
}
Turning off the cookies causes some user tracking in Application Insights to stop working but does not affect Page View Tracking.
You can interact with this data in a few ways when the client telemetry is sent to Application Insight.
1. Performance Overview
The Performance Overview in Application Insight defaults to server telemetry and operations. Still, you can switch it to client telemetry for an overview of browser performance by selecting Browser rather than Server.

2. Usage statistics
The Usage section in Application Insights gives you an overview of aggregated data such as users, sessions, page views, and custom events over some time.

3. Workbooks
Workbooks are customizable reports to make analytics easier and more understandable. Workbooks can be based on any data in Application Insights with pre-built ones on client telemetry and usage.

4. Log analytics
Most of the data visible in Application Insights is available as tables through the Logs section. This is the most flexible and complex way to interact with the client telemetry. Most client telemetry is available in the table called pageViews and browserTimings.
Example queries
-
View page views for the last 30 days.
pageViews | where timestamp > ago(30d) | summarize count() by bin(timestamp, 1d) | render timechart -
Count of unique users.
pageViews | where timestamp > ago(30d) | summarize dcount(user_Id) -
Page views by site.
pageViews
| where timestamp > ago(30d)
| extend site = split(url, "/")[2]
| summarize count() by tostring(site)
See also Microsoft Documentation.
5. Disable unload event
Chrome has deprecated the unload event (see Deprecating the unload event). If you run Lighthouse to check Performances, SEO, and see Best practices, a warning displays.
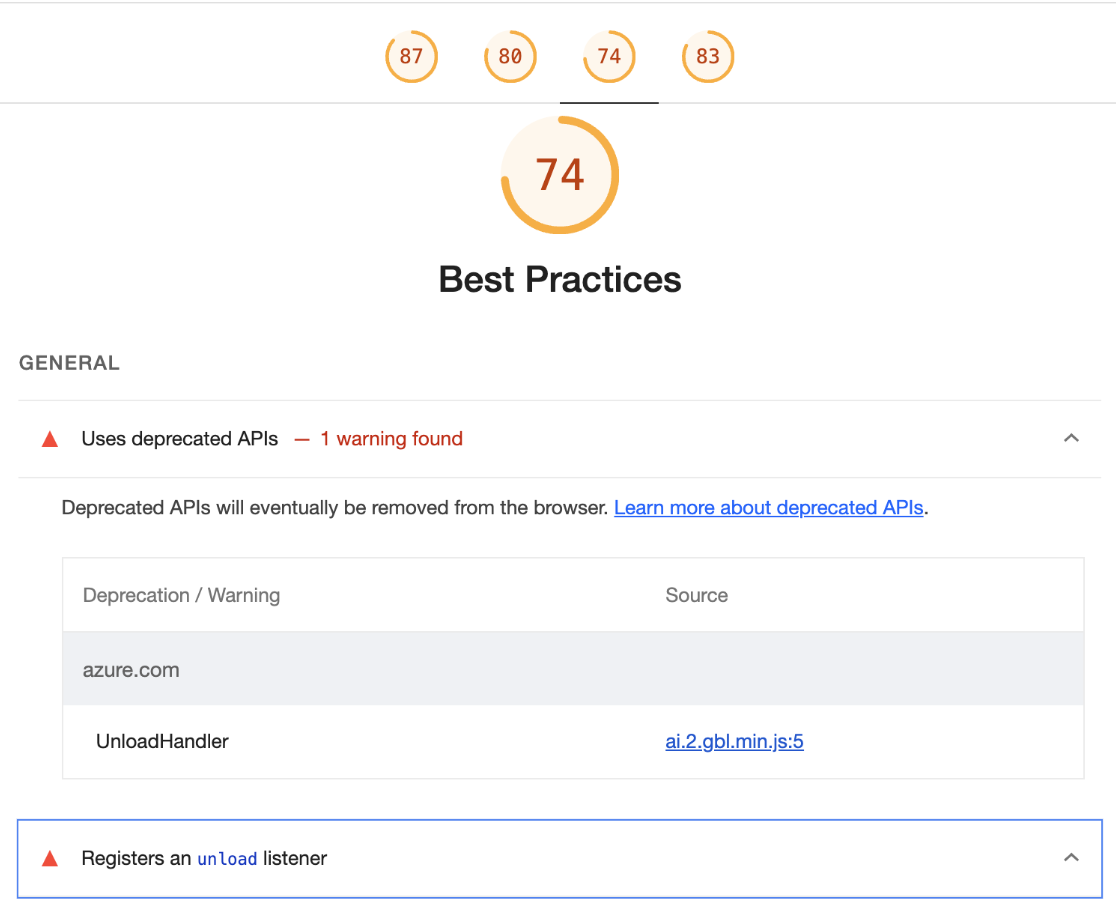
To prevent that, configure disablePageUnloadEvents in either of the following ways.
In appSettings.json:
public void ConfigureServices(IServiceCollection services) {
    services.Configure<InstrumentationOptions>(o => o.DisableUnloadEvent = true);
}
In EPiServer.CloudPlatform.Cms:
{
  "EPiServer": {
    "Cms": {
      "Instrumentation": {
        "DisableUnloadEvent": true
      }
    }
}
Updated 3 months ago