
Search Management portal
Use Search Management portal to monitor search performance, manage pinned results, and configure synonyms across your Optimizely Graph instances.
BetaSearch Management portal is in beta. You can access this feature if you have all of the following:
- Opti ID
- Optimizely Graph instance access
Search Management portal is a centralized admin dashboard for managing search experiences across your Optimizely Graph instances. Use the portal to monitor search performance, curate results for specific queries, and define synonym relationships that expand query matching.
Access the Search Management portal
Open Search Management portal from the Optimizely global navigation bar.
- Sign in to your Optimizely account.
- Select Graph in the global navigation bar.
- Click your tenant (also called a Graph instance).
Grant per user access to the portal
In Admin Center, select the applicable Product, Instance, and Role you want to assign to the user, then select the checkmark to save. Without this access, the portal does not display in the global navigation bar. For more details, see Manage users.
NoteIf Graph is still not visible, contact Optimizely support to confirm Opti ID access. Alternatively, contact your Admin Center administrator to request Graph tenant access.
Go to the portal
Search Management portal organizes features into two areas in the navigation panel.
- Health & Monitoring – Contains the Overview page, which is the search analytics dashboard.
- Search Tools – Contains Pinned Results for curating search result ordering and Synonyms for managing search term relationships.
- Performance dashboard – Contains data on how fast your search queries run and how effectively Optimizely Graph serves them from cache.
- Development accounts – Contains a way to create an isolated environment to evaluate and test Optimizely Graph without affecting production systems.
Overview dashboard
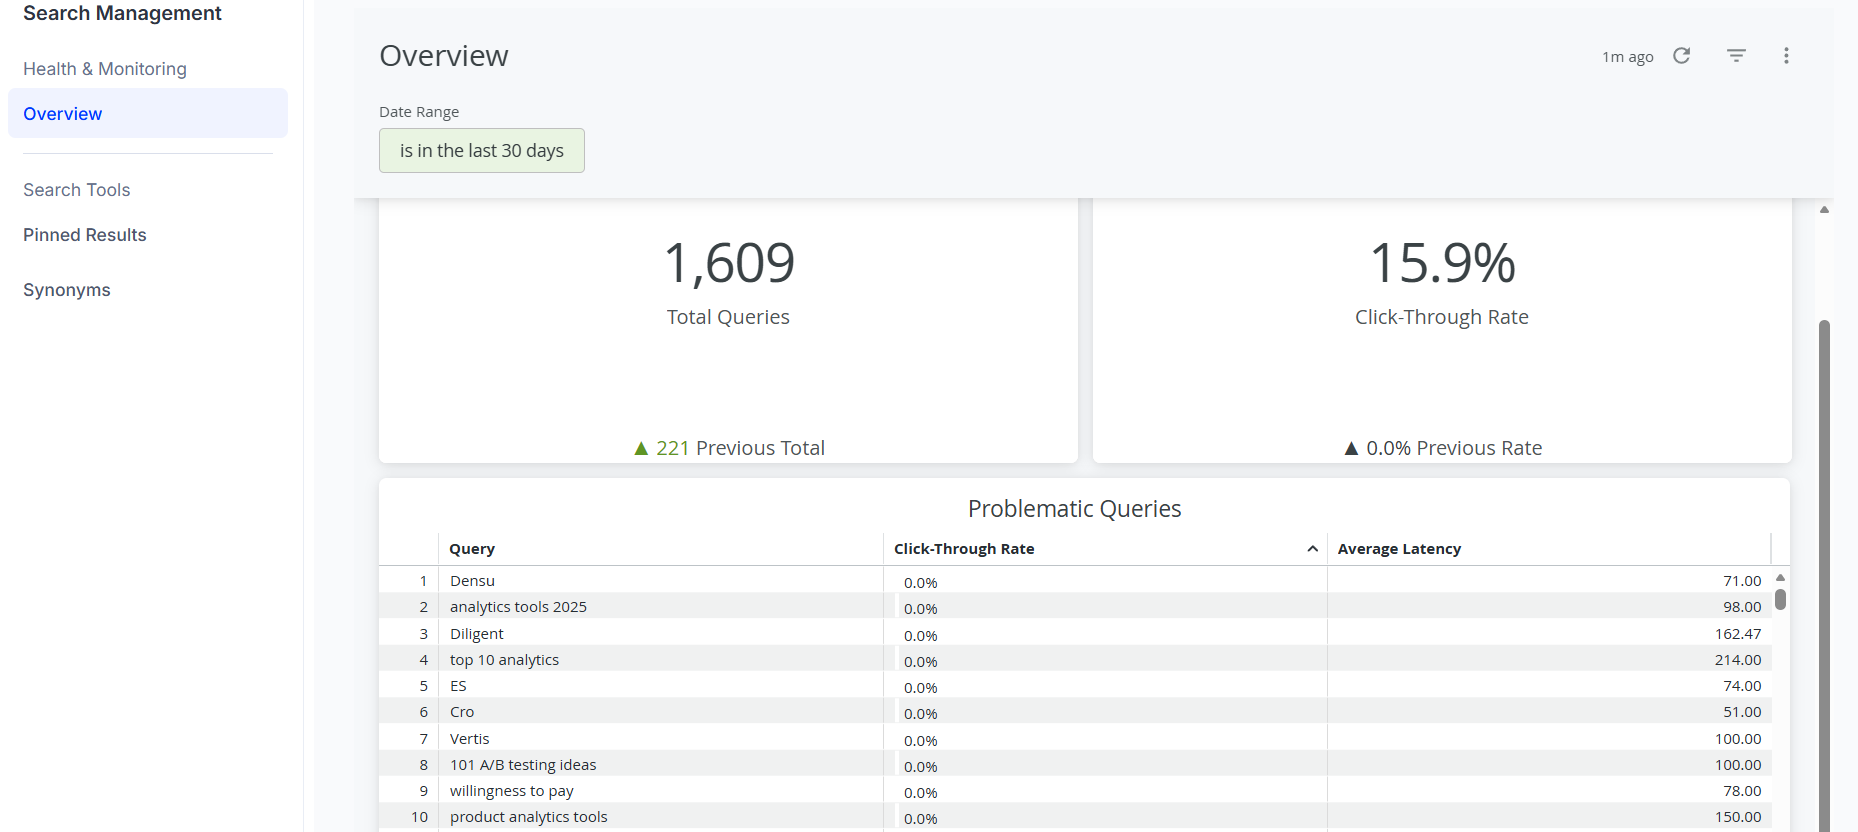
The Overview dashboard displays search analytics and performance metrics through an embedded analytics interface. Enable Search hit tracking on your site before this dashboard shows results. The Overview dashboard is the default landing page after you sign in.
Available metrics
The dashboard displays the following metrics for the selected date range.
- Total Queries – Aggregate count of search queries submitted during the selected date range.
- Click-Through Rate – Percentage of searches that resulted in a click. Use this metric to gauge search effectiveness.
- Problematic Queries – Table of queries with low or no click-through rates. Use this table to identify optimization opportunities. To sort the table by query term or click-through rate, select the column header.
Filter data by date range
Use the date range filter to analyze a specific time period.
- Click Date range filter. The default range is the previous seven days.
- Choose a predefined range or enter custom dates.
- Click on an area outside the filter to apply the date range.
The dashboard updates all metrics automatically.
Refresh data
Click Refresh to reload the latest analytics data. The timestamp shows when the data last refreshed.
Updated 2 months ago