
Performance dashboard in Search Management portal
Use the Performance dashboard in Optimizely Graph to monitor query response times and cache hit ratios, find slow queries, and keep search fast.
BetaSearch Management portal is in beta. Access this feature when you have the following:
- Opti ID
- Optimizely Graph instance access
The Performance dashboard shows how fast your search queries run and how effectively Optimizely Graph serves them from cache. Use it to monitor query response times and cache hit ratios and keep search fast for your users. Under Health & Monitoring, click Performance to open the dashboard.
The dashboard has two parts. The table lists response times and cache hits for each query. The line chart plots cache hit percentage over time.
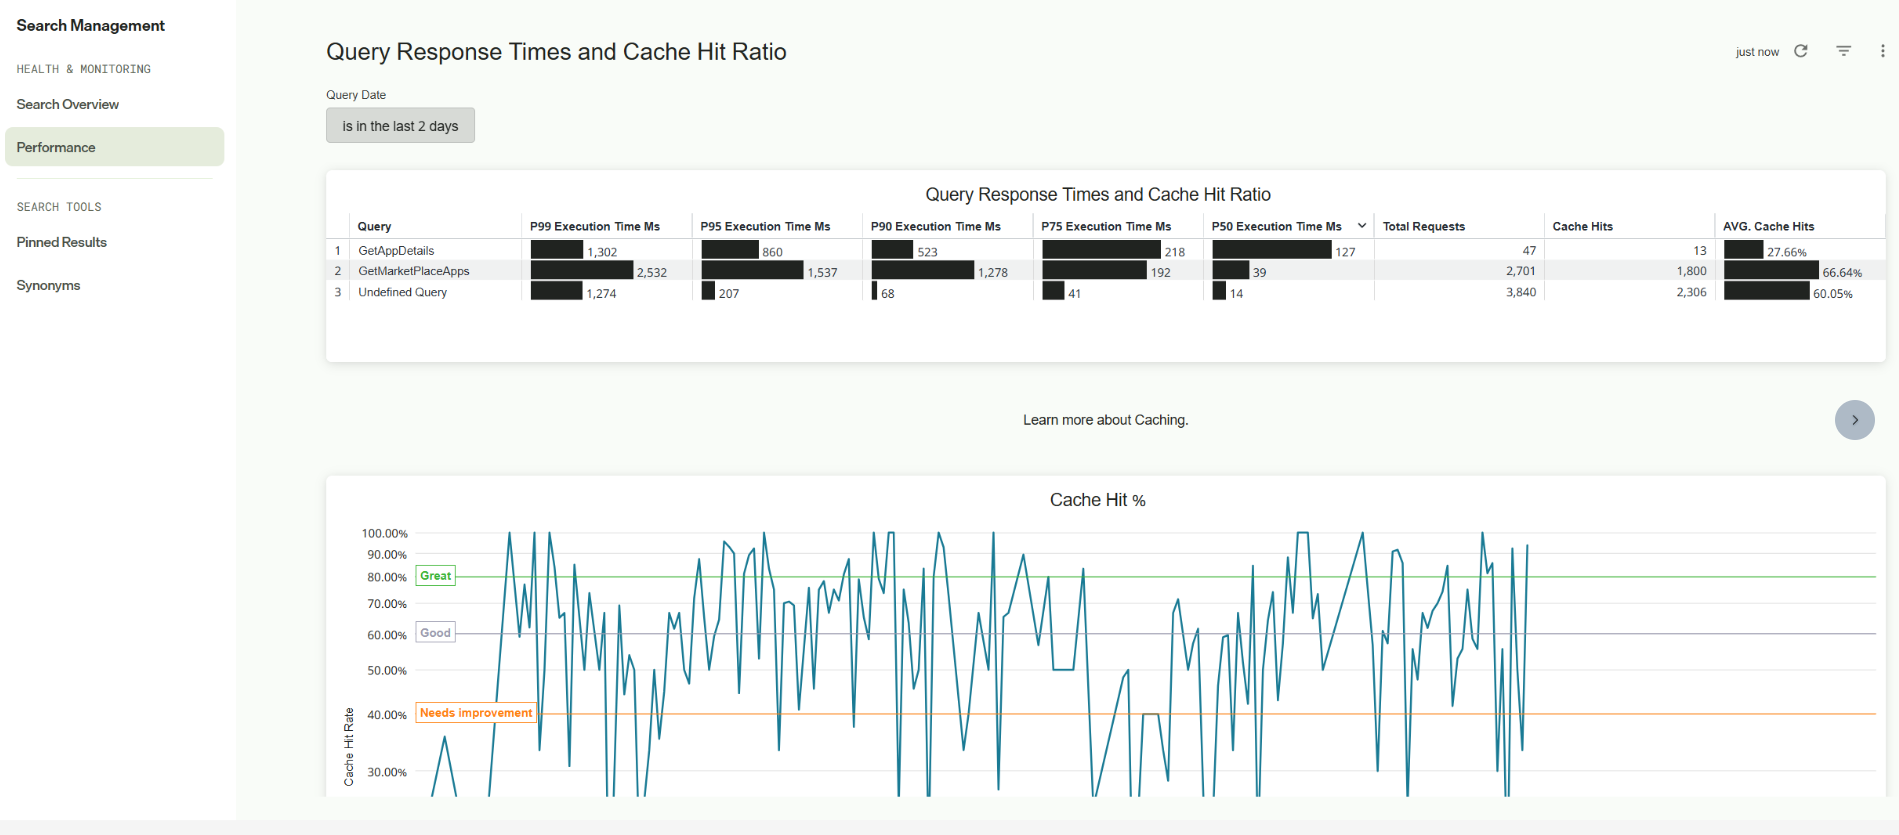
Query response times and cache hit ratio table
The table shows performance metrics for each query type in your application. It includes the following columns:
- Query – The name or type of search query that ran.
- P99 Execution Time Ms – The 99th percentile execution time in milliseconds, which covers the slowest one percent of queries.
- P95 Execution Time Ms – The 95th percentile execution time in milliseconds.
- P90 Execution Time Ms – The 90th percentile execution time in milliseconds.
- P75 Execution Time Ms – The 75th percentile execution time in milliseconds.
- P50 Execution Time Ms – The median (50th percentile) execution time in milliseconds.
- Total Requests – The number of requests for this query type in the selected time period.
- Cache Hits – The number of requests served from cache.
- AVG. Cache Hits – The average cache hit rate as a percentage.
Each execution time column includes a horizontal bar chart for visual comparison across queries.
Filter and refresh the table with these controls:
- Query Date – Select a time period from the drop-down list. The default is the last two days.
- Refresh – Click to reload the table.
Cache hit percentage chart
The line chart shows your cache hit percentage over time so you can spot trends and potential issues. The chart divides cache performance into three zones:
- Great – A cache hit rate above 80 percent (green), which indicates optimal performance.
- Good – A cache hit rate between 60 percent and 80 percent, which indicates acceptable performance.
- Needs improvement – A cache hit rate below 40 percent (orange), which indicates poor performance that requires attention.
Interpret the metrics
Use the following guidance to read the dashboard.
Response times
Lower values indicate faster queries and a better user experience. Read the percentiles together:
- P99 and P95 – Reveal the worst-case performance your users experience.
- P50 – Represents typical performance for the median request.
Compare percentiles to find queries with inconsistent performance.
Cache hit ratio
Higher percentages indicate more cache hits, which reduce server load and improve response times. Aim for a cache hit rate of 80 percent or higher. A declining cache hit rate often points to one of the following causes:
- Increased traffic with unique queries.
- Cache expiration issues.
- Changes in query patterns.
To improve cache efficiency, see Cached templates.
Best practices for the Performance dashboard
Follow these practices to maintain search performance:
- Monitor P99 response times – These values represent the slowest experiences for your users.
- Investigate queries with low cache hit rates – Consider query optimization or cache configuration changes.
- Set up alerts for low cache hit rates – Configure an alert when the cache hit rate drops below 60 percent.
- Compare metrics before and after changes – Measure the impact of each optimization.
- Review high-volume queries first – Focus on high-volume queries with poor performance for the greatest impact.
Troubleshoot performance issues
Use these responses when the dashboard shows a problem:
- High response times – Review query complexity and consider optimization.
- Low cache hit rates – Check the cache configuration and query patterns.
Undefined Queryentries – Review the application code so the application names each query.- Inconsistent performance – Investigate infrastructure or data volume changes.
Updated 2 months ago