Reports (deprecated)
(Deprecated) Shows how to view reports from Optimizely Visitor Intelligence.
DeprecatedVisitor Intelligence and Profile Store are deprecated and no longer supported. For migration options to Optimizely Data Platform (ODP), contact your sales representative or customer success manager.
See Remove dependencies on Visitor Intelligence and Profile Store.
Optimizely Visitor Intelligence provides the user interface to view reports to bring insights into collected customer data. Each report is listed separately in the Reports section.
Data can be separated into different scopes by a developer. A scope is used to separate data belonging to a business area, such as brands or markets, or to separate the behaviors of a tracked user. Each user can have a separate profile and interactions history per scope so that personalization and marketing activities are relevant to the behavior within the context of that scope.
Commerce report
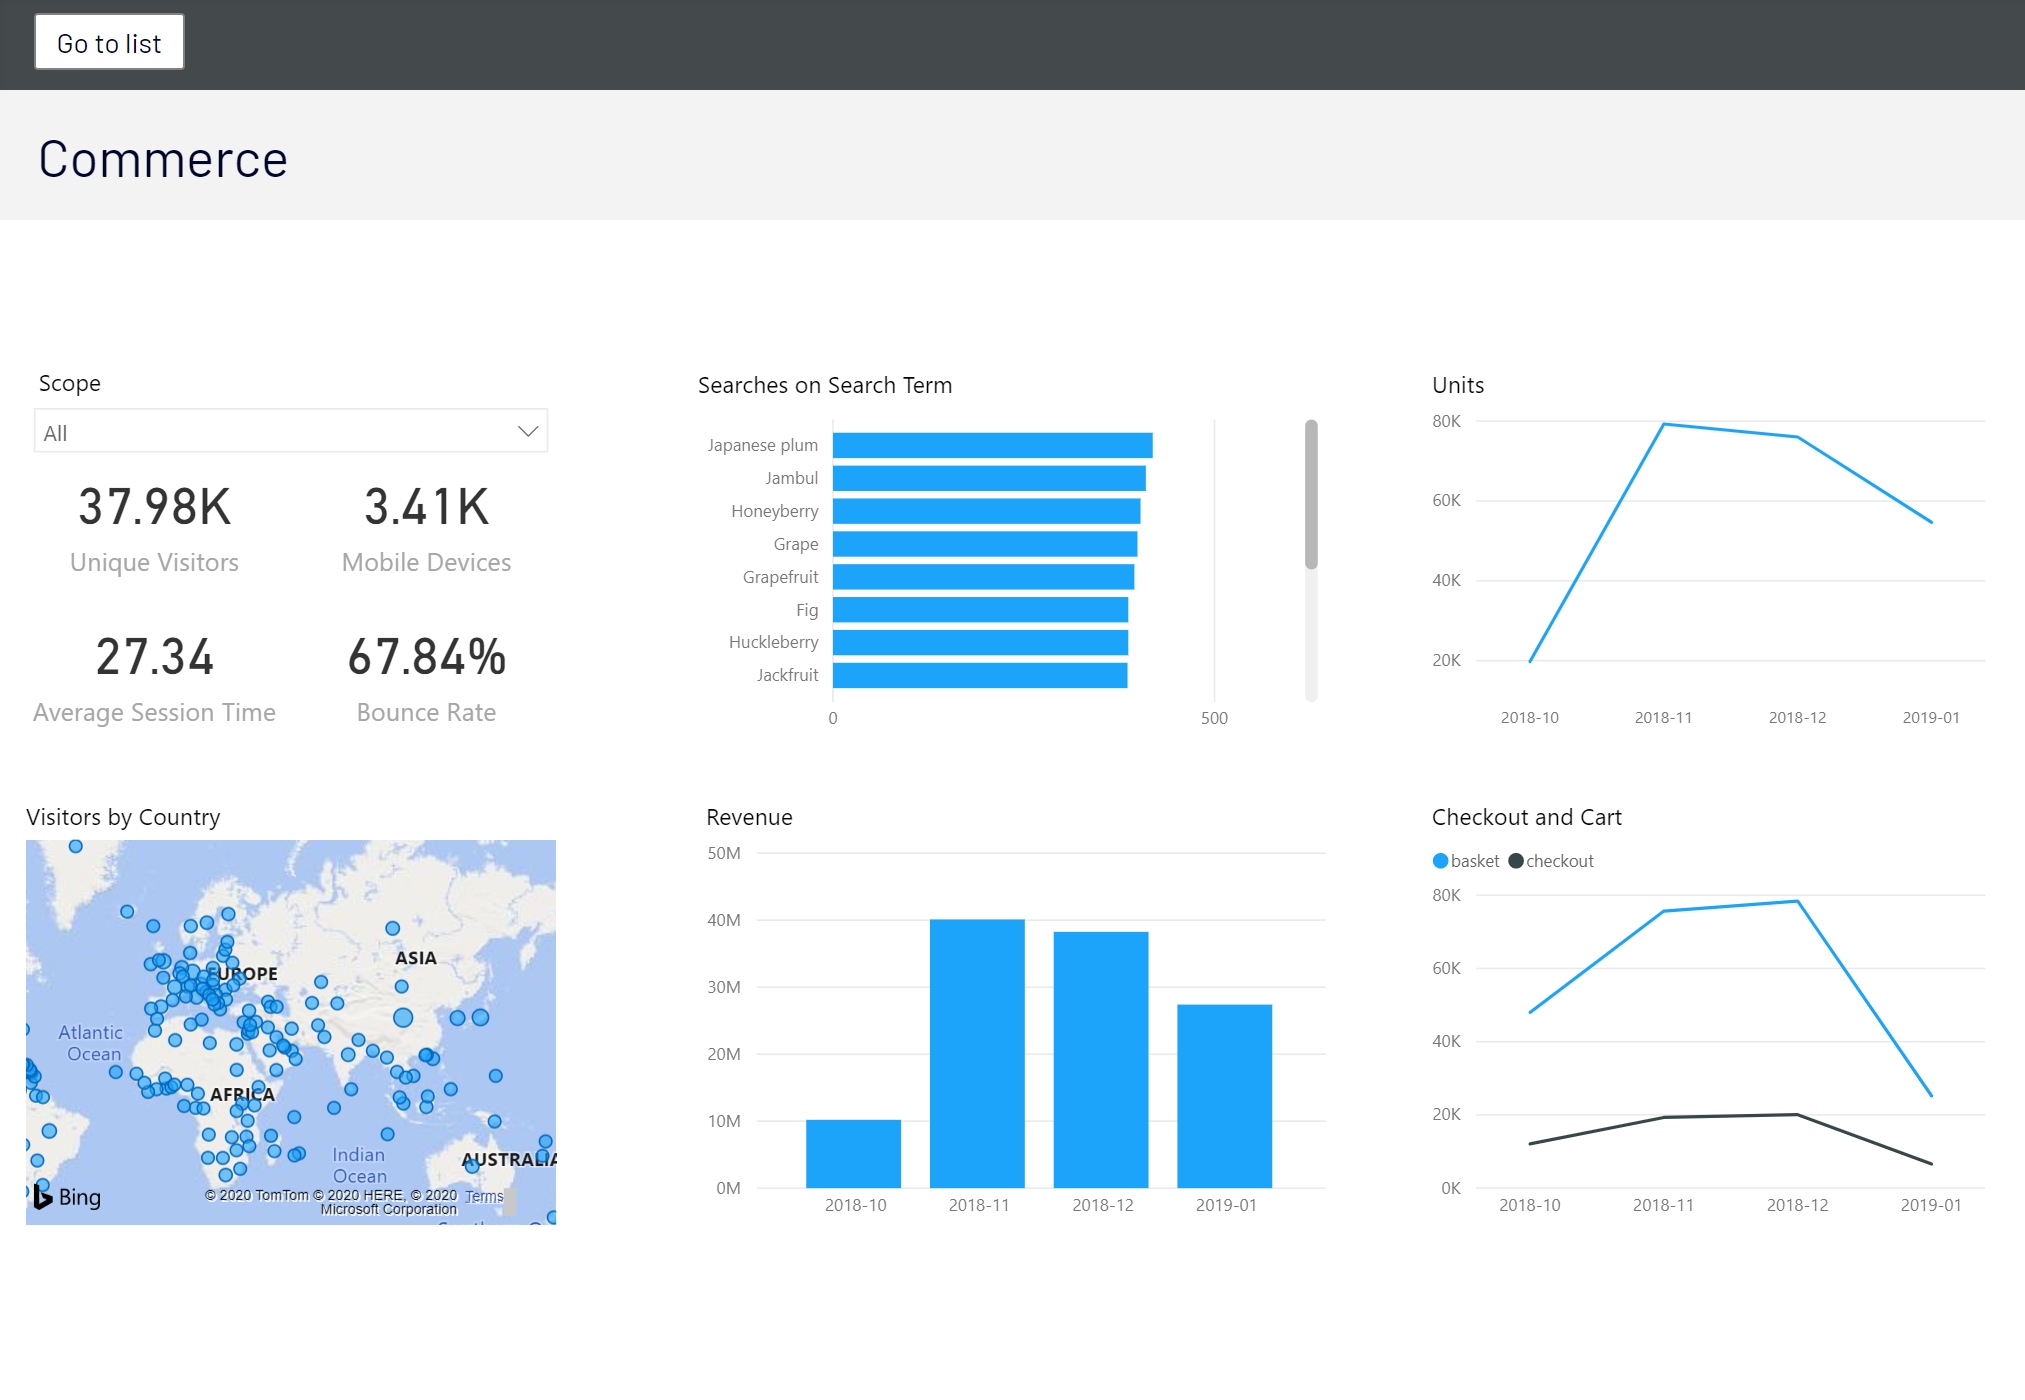
The Commerce report contains the following charts for an ecommerce site. The charts help you understand how visitors are interacting with your site. The report is updated every hour. The reporting period is three months from the past hour. The reporting period cannot be changed in the current version of Optimizely Visitor Intelligence.
- Scope Selector. In the scope selector you can select a scope and see charts for that scope. By default, All Scopes is selected and data from all scopes are applied to charts. This is not an issue if you only have one scope in Profile Store, but you should keep in mind that it mixes profiles and track events across all scopes when your site has more than one scope.
- Unique Visitors. Number of unique profiles who visited the site.
- Mobile Devices. Number of mobile devices used to visit the site.
- Average Session Time. The average time visitors spend on the site in each session.
- Bounce Rate. The percentage of visitors who only visited the first (landing) page in the site and did nothing else.
- Visitors by Country. Number of visitors from each country/region. The size of the circle presents the amount of visitors.
- Searches on Search Term. Number of searches for each keyword that a visitor typed in the search bar.
- Daily Revenue. Total sells in each day.
- Units. Number of products sold in each day.
- Checkout and Cart. Number of checkouts and number of actions that added product into the shopping cart.
Updated 10 months ago